The provision of public information and warnings plays a vital role in supporting safer communities before, during and after an emergency. The variability of Australia’s hazard warnings has led to lower levels of trust and credibility in warning systems. This presents a significant barrier to effective community comprehension and response to warning messages. In 2018, a national social research project was initiated to examine community understanding and response to current warning systems to identify the features of a best-practice national system incorporating community voice. This project involved 4 stages of quantitative and qualitative research that surveyed 16,585 people in Australia between 2018 and 2020 to achieve a statistically robust evidence base. Hazards investigated included bushfire, cyclone, flood, extreme heat and extreme weather. This paper presents the findings of this research and discusses implications for the development and implementation of a new 3-tiered national warning system for multiple hazards.
Introduction
In Australia, warning systems vary significantly across hazards and jurisdictions, with only bushfire and tsunami having established national warning frameworks. This presents a significant barrier to people to comprehend and respond to warnings messages. In recent years, emergency services organisations have collaborated to pursue and develop a national warnings system. The aim of this study included investigating what a new multi-hazard communication tool would look like that assisted communities to understand threats and encouraged people to take protective action.
Emergency services organisations and research institutions have invested significantly to improve community comprehension and response to warnings messages. A comprehensive review (Emergency Management Victoria 2014) compiled then-current systems and set clear directions for improvement, including a call for governance and coordination of public information practice at the national level. Since that time, research through the Bushfire and Natural Hazards Cooperative Research Centre (BNHCRC) Effective Risk and Warning Communication project has identified how warning messages can be better constructed and translated into direct action through testing of wording and structure (Greer et al. 2020a, 2020b, 2020c). In addition, a national direction for best practice was set and a Total Warning System was published in the Public Information Warnings Handbook (Australian Institute for Disaster Resilience 2018).
Post-incident and BNHCRC studies identified barriers to comprehension of warnings during emergencies. For example, in two fires, the Reedy Creek Swamp fire of 2018 in NSW and the Sampson Flat fire of 2015 in South Australia, the communities failed to understand the meaning of the message ‘take shelter’. The result was people failed to appropriately act either because they did not understand (Whittaker et al. 2020) or because they misinterpreted the actions required, which ranged from ‘wait and see’ to ‘leave now’ (Every et al. 2016). In response to BNHCRC and other research findings, several jurisdictions have reviewed their warning systems to make warning messages effective and easier to understand by bringing critical information upfront and simplifying the wording. However, not all emergency services agencies have the capacity to change systems and there has been resistance to developing consistent messaging across borders and hazards.
In 2018, these challenges were explored by Anderson-Berry and co-authors (2018) in their comprehensive review of the total warning system concept and how it might be applied in Australia. Their findings reinforced the importance of taking a ‘people-centred’ approach to achieve an effective warning system, rather than a hazard-based approach. In a people-centred system, the messaging is directly relevant to those at risk and is about protective actions to take and the likely consequences rather than about the hazard.
Acknowledging the priority of consistent warnings across hazards, the Commissioners and Chief Officers Strategic Committee (CCOSC) of the Australasian Fire and Emergency Services Authorities Council (AFAC), committed to establishing a nationally consistent 3-level warning framework across multiple hazards. In 2018, CCOSC supported seeking community voice to inform a national warning system for multiple hazards in conjunction with the Australian Fire Danger Rating System (AFDRS) social research. The AFDRS research findings are currently informing the development of the new risk communication tool for fire danger (O’Donohue & Dunstan 2019, AFAC 2019).
This paper explores warning systems from a national multi-hazard perspective to inform the development of a consistent 3-tiered national warning system to communicate hazard threat and promote desired protective behaviours for bushfire, cyclone, flood, extreme weather and extreme heat. Regional, state and territory as well as national data was collected (Metrix 2020 multiple reports), including results from within jurisdictions (not discussed here).
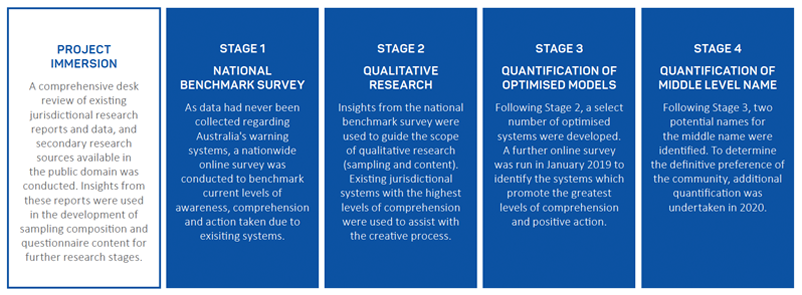
Figure 1: Overview of research methodology for the Australian National Multi-Hazard Warnings Social Research Project.
Methodology
This research was undertaken alongside the National Fire Danger Ratings Social Research with the methodology previously published (O’Donohue & Dunstan 2019). A fourth stage was added for the warnings project as illustrated in Figure 1. The methodology was co‐developed by Metrix and a Project Steering Group with all subsequent project survey tools and reports drafted by Metrix and reviewed in consultation with steering and reference group members. The Metrix natural-hazard transtheoretical model, Seven Stages of Behaviour Change, was applied to support data analysis. This model is described in the Stage 1 Report (Metrix 2018) and differs from the traditional model:
- Recognition of risk is more complex (transitioning from general risk recognition to personal risk assessment to personal risk recognition).
- The decision to prepare does not always follow knowledge.
- Action is separated into 2 low- and high-engagement categories.
Table 1 summarises the sampling dates, sizes and error margins. The quantitative data was weighted by age and gender for representativeness at national and jurisdictional levels. Qualitative research sample locations included areas where minor or major incidents have occurred in the past 5 years, areas where no incidents have occurred in the past 5 years and low-risk areas. A cash incentive of up to $100 was provided to focus group participants to maximise participation. Some participants were filmed discussing their personal experiences of recent emergencies. In Stage 4, testing scenarios were restricted to 3 hazards of bushfire, floods and cyclones. Each participant was asked questions relating to 2 hazards on a randomised basis.
The study was conducted inline with the Research Society Code of Professional Behaviour, accredited by the Association of Market and Social Research Organisations (AMSRO) requiring adherence to the Privacy (Market & Social Research) Code and the AMSRO Code of Professional Behaviour and certified by the International Standard for Market, Opinion and Social Research certification (ISO 20252).
Table 1: Dataset summary for the Australian National Multi-Hazard Warnings Social Research Project.
| Research stage | Method | Field data collection | Total sample size | Maximum margin of error |
| Stage 1: National Benchmark Survey | ||||
| Benchmarking awareness, comprehension and effectiveness of the warning systems in each jurisdiction and for each hazard. | National online survey | 14–27 September 2018 | n=5430 | ±1.33% at 95% confidence |
| Stage 2: Qualitive Research | ||||
| Detailed insight into the required form and characteristics of hazard warning systems including critique of local and interstate systems. | 47 focus groups and 1 workshop | October to November 2018 | n=340 | |
| Sample locations | ACT (3), NSW (8), NT (3), Qld (9), SA (5) + 1 workshop, Tas (4), Vic (8), WA (7) | |||
| Stage 3: Quantification of Optimised Models | ||||
| Quantifying the characteristics of a warning system that promotes the greatest levels of comprehension and positive action. Concepts tested were derived from stages 1 and 2, with the proviso that if a concept was untenable for implementation, it would not be included. | National online survey | 24 May to 9 June 2019 | n=5408 | ±1.33% at 95% confidence |
| Stage 4: Quantification of Middle Level Name | ||||
| Identifying the community’s definitive preference for the name of the middle level and the optimised order of a nested warning including the warning level name, hazard, location and calls to action at different levels within a multi-hazard warning system. | National online survey | 27 July and 9 August 2020 | n=5407 | ±1.33% at 95% confidence |
Results and discussion
Results are a summary of the project findings with more detail available in the project reports (Metrix Consulting 2019, 2020). Overall results complement and re-enforce the findings of previous studies, however, detailed examination of the previous findings is beyond the scope of this paper.
The initial challenge was ascertaining a national benchmark for levels of warning awareness and comprehension across Australia, given that there is no consistency across the states and territories. Which agency is responsible for issuing hazard warnings and how the threat information is communicated to the public varies considerably between jurisdictions. Figure 2 shows the variation in style, colours, pattern and content of warning mapping icons across Australia.
Depending on jurisdiction, public information and warnings for flood and storm hazards may be issued by State Emergency Services, local governments, Bureau of Meteorology and other agencies. A Flood Watch warning may be used to advise of either potential flood risk or an approaching flood threat depending on where you are. Western Australia has a well-established suite of warning systems including the tiered cyclone warnings of Blue, Yellow and Red Alert that have clear calls to action. In comparison, the Northern Territory uses the Bureau of Meteorology tropical cyclone categories 1–5, which are the severity measures for cyclones, rather than using a targeted warning system.
Of the 5 hazards tested, only bushfire has a nationally agreed 3-tiered Bushfire Warning System (Australian Emergency Management Committee 2009). Even so, implementation is not consistent, as shown in Figure 2 by the differences between colours, shapes and icons. Victoria is the only state to have implemented an all-hazard warning system and this system was used during this research when discussing action-specific, as compared with hazard-specific, warning icons.
How messages are communicated is also not standardised across Australia. Depending on locality and jurisdiction, communities may hear of or see a hazard warning message through official or unofficial channels via radio, television, print media, websites, social media, phone apps, texts, signage (permanent, temporary, manual or electronic) and community networks. For example, the Emergency Alert system1 is a national product that allows text messages to be sent to mobiles. However, usage and wording varies depending on jurisdictional processes and capabilities.
Personal risk recognition
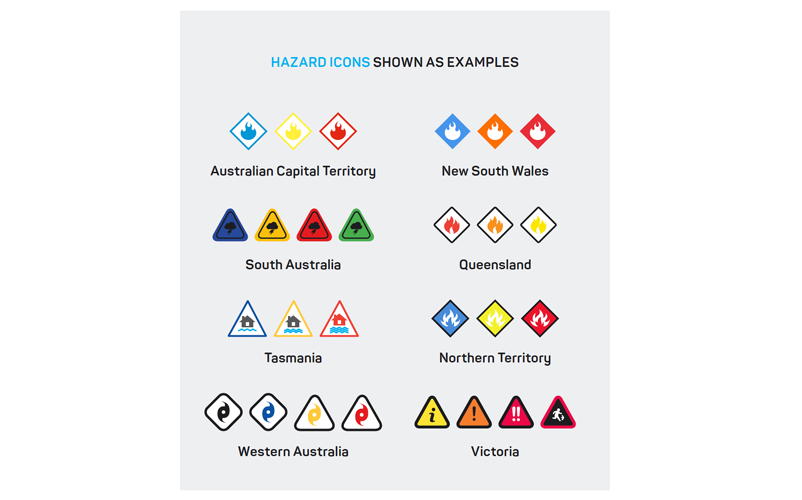
Figure 2: Variation in warnings graphics in Australian states and territories in 2018.
An increase in personal risk recognition correlates with an increased awareness of the risk of bushfires, cyclones and floods. The Stage 1 report provided a national benchmark for awareness, comprehension and action taken that correlated results with personal risk recognition and levels of behaviour change (Metrix Consulting 2018). The report showed a substantial drop from recognising the risk of bushfires, cyclones and floods, to feeling personally at risk from these hazards (see Figure 3). That is, people are aware that a hazard may occur and may impact on the area, but they don’t think it will affect them personally. In contrast, severe storms and extreme heat have stronger conversion likely due to these hazards being more widespread.
Risk recognition was influenced by a person’s birthplace, family composition, location and home-type. People born or raised in Australia and living in regional areas or with larger properties and standalone houses tended to have greater personal risk recognition. Proximity to bushland and open water increased subsequent risk recognition of fires and floods. Overall, the findings are consistent with previous studies, with community awareness and comprehension closely aligned to personal experience of emergencies or the risk profile of individuals. This shows the importance of focusing on the personalisation of risk in messaging and engagement activities to improve comprehension and prompt protective action.
‘Forecasts’ verses ‘warnings’
The way the community talks about forecasts and warnings is inconsistent. In the focus groups, references to forecasts, warnings and alerts were common and were used interchangeably, often thought to mean the same thing. While respondents did not have a strong preference for terminology on initial consideration, when speaking about previous experiences most defaulted to the use of the term ‘warnings’.
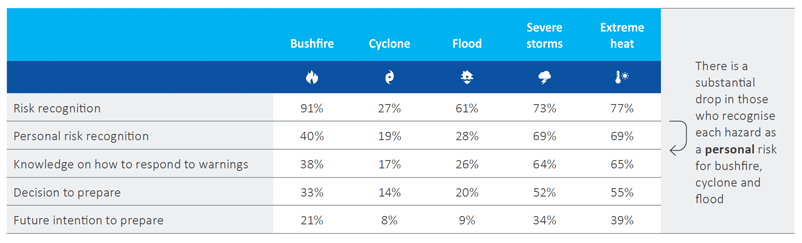
Figure 3: Natural-hazard behaviour change model. Percentage of participants at each stage of the model for each hazard (September 2018).
Awareness is limited
When prompted, less than half of respondents recalled warning messages for cyclone, flood and bushfire, but over half recalled warnings for extreme heat and extreme weather (see Table 2). Awareness of warnings increased significantly for participants with personal experience. This was consistent with focus group findings. There was limited familiarity with jurisdictional warning systems overall except for the Western Australia Cyclone Warning System.2 In most cases, participants could only identify 1 or 2 warning levels and had significant difficulty when asked to create an optimised warning system, as few had an existing reference point.
Table 2: Prompted awareness of hazard warnings of Australian population n=5430 at 95 per cent confidence level ±1.33 per cent.
| Population | Individuals with experience of the hazard | |
| Bushfire | ||
| Prompted awareness | 44% | 60% |
| Have taken action in past due to a warning* | - | 49% |
| Cyclone | ||
| Prompted awareness | 41% | 79% |
| Have taken action in past due to a warning* | - | 58% |
| Flood | ||
| Prompted awareness | 45% | 65% |
| Have taken action in past due to a warning* | - | 35% |
| Extreme Weather | ||
| Prompted awareness | 56% | 70% |
| Have taken action in past due to a warning* | - | 52% |
| Extreme Heat | ||
| Prompted awareness | 55% | 71% |
| Have taken action in past due to a warning* | - | 56% |
* Percentage of those who have been exposed to this hazard in the past.
Varied levels of awareness and motivation
Over half of participants had taken action in response to a bushfire, cyclone, extreme weather or extreme heat warning, but significantly fewer had taken action in response to a flood warning. Levels of awareness and response to hazard warnings varied significantly between states and territories. Half of the participants exposed to a bushfire warning had taken action, although significantly more were from regional Western Australia (63 per cent). Awareness of cyclone warnings was significantly higher in the Northern Territory (87 per cent), regional areas of Queensland (77 per cent) and Western Australia (67 per cent). However, the action taken varied by jurisdiction. Awareness of flood warning systems fluctuated regionally and was significantly lower in South Australia (16 per cent), Tasmania (21 per cent) and Victoria (33 per cent), and significantly higher in Queensland (70 per cent) and the Northern Territory (61 per cent). Few respondents exposed to flooding had taken action in response to warnings, even in flood-prone areas. This is significantly lower compared to other warnings systems.
Extreme weather warnings have significantly higher recognition in regional New South Wales (73 per cent), Queensland (77 per cent) and Western Australia (70 per cent) with thunderstorm warnings the most common type recalled (70 per cent). Respondents in regional New South Wales (70 per cent) and Queensland (65 per cent) had significantly higher recognition of extreme heat warnings, most likely due to the frequency and geographic reach of these events.
Low awareness levels and inaction
Low awareness and comprehension and negative perceptions about warnings can result in inaction and inappropriate behaviour. More than half of participants who had received official warnings felt the warnings resulted in frustration and disengagement. Where there had been significant events, participants commonly spoke of receiving official warnings, either after an incident had passed or considerably later than other nonofficial sources. This led to a sense that the warning content was unreliable. Those participants who had received warnings in a timely manner were almost always satisfied with the content. When warnings are perceived to be not current or not relevant, the credibility of the system is called into question and the likelihood of risky behaviour increases.
Identifying required actions
Many respondents were unable to identify the actions required for bushfire warnings. The understanding of the required behaviours was 56 per cent for ‘Advice’ level, 53 per cent for ‘Watch and Act’ level and 57 per cent for ‘Emergency’ level warnings. The Watch and Act warning achieved unprompted recall in the focus groups, but over two-thirds of participants were confused by the contradicting instructions in the name.
Awareness and action taken from flood warning systems varied by jurisdiction and was higher in (wet season) flood-risk areas of regional Western Australia, Northern Territory and Queensland. But there was a marked confusion over desired actions for all flood warning systems and participants had particular trouble identifying the required actions for levels with names that had a similar perceived meaning, for example ‘Flood Advice’ and ‘Flood Watch’ (see Figure 4).
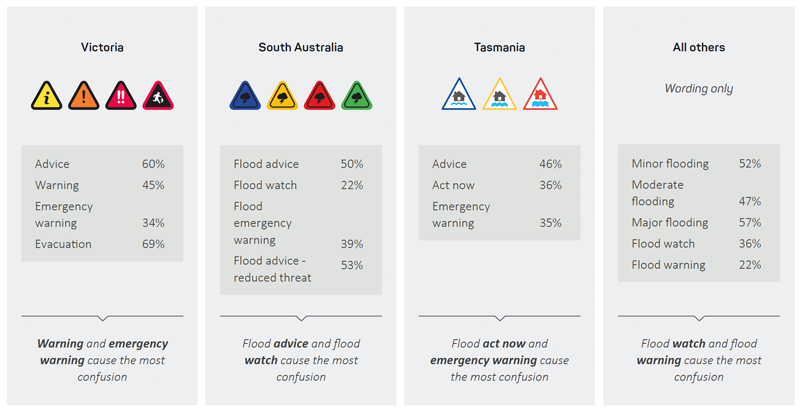
Figure 4: Correct action for a given flood warning. Percentage of Australian population n=5430 at 95 per cent confidence level ±1.33 per cent.
Current warning system strengths
Participants identified a variety of strengths and weaknesses in the current warning systems. Focus group participants critiqued current warning systems that were relevant to their location and explored what a multi-hazard warning system might look like. After reviewing existing warning systems in Australia, strengths and weaknesses of hazard warning systems were identified (Figure 5).
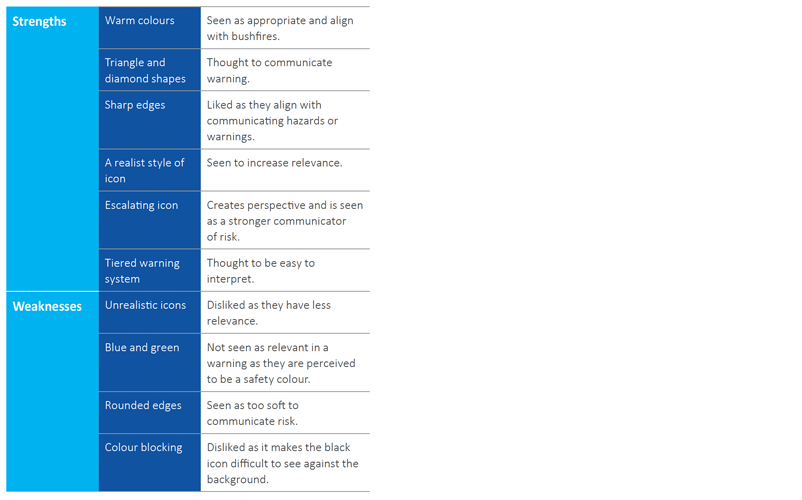
Figure 5: Perceived strengths and weaknesses of Australian warning systems (2018, n=340).
Preferred warnings wording
Participants across all focus groups supported a consistent multi-hazard warning system with wording that is:
- short and simple: avoiding words that are long, uncommon, difficult and or ambiguous
- action-orientated: quickly understood (e.g. prepare, evacuate)
- consistent: increases comprehension and decreases confusion.
The majority of participants viewed a 3-tiered warning system as suitable for bushfire, cyclone and flood. However, a different approach was thought to be required for extreme weather and extreme heat warning. Individuals perceive the risk of these hazards differently with extreme heat and weather considered a part of life and an ‘on-off’ warning system was preferred.
Preferred warnings imagery
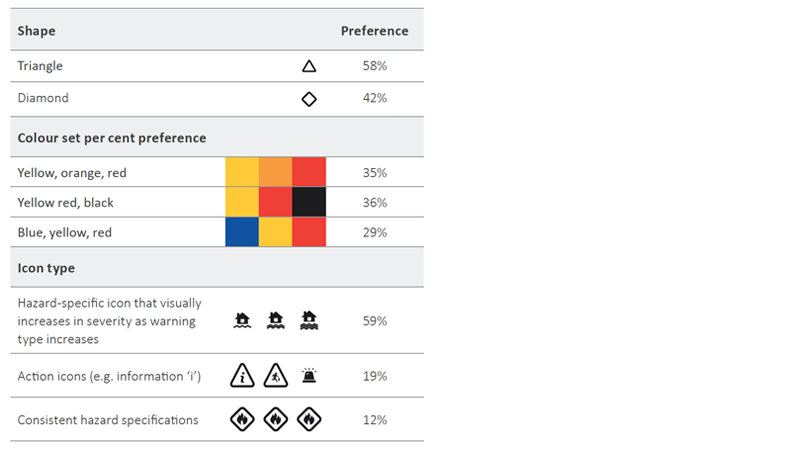
The most effective visual design is a triangle system with hazard-specific icons that increase in severity and a warm colour palette. Participants created and tested their own online warning system using the identified shapes, icons, colours and word sets for each warning level (summarised in Table 3). The majority chose a triangle system with hazard-specific icons that increase in severity, which was consistent across jurisdictions and hazard types. The most effective colour set varied by hazard type, though a warm palette was intuitive for most with red associated with high danger. Although over a third of participants preferred a red-yellow-black colour set, yellow-orange-red was equally as popular. Given that black is associated with burnt areas (on maps), yellow-orange-red was the preferred option to show hazard escalation. Blue is currently in use for bushfire and cyclone warnings but was not supported in survey data.
Table 3: Preferences for warning hazard icon shape, colour and type (2019, n=5408, ±1.33 per cent at 95 per cent confidence).
Preferred warnings names unclear
The Stage 3 findings provided no clear preferences for names of warnings (Figure 6). The first level of warning was associated with alerting the community that something is happening, seeking information or monitoring conditions correlating with words such as ‘Prepare’, ‘Warning’ and ‘Alert’. The most effective words for the second level were around ‘Act’, suggesting this is important to include. There was significant confusion associated with ‘Watch and Act’, which suggests that maintaining the words poses a risk to community understanding without providing additional messaging. The community preference for the naming of the highest-level warning was not tested, as the word ‘Emergency’ was identified as non-negotiable during co-design.

Figure 6: Percentage participant preference for first and second level warning words, where Level 3 is ‘Emergency Warning’ (2019, n=5408, ±1.33 per cent at 95 per cent confidence).
The term ‘Reduced threat’ was seen to effectively communicate a warning de-escalation message. This was the first time a de-escalation message has been explored and findings were consistent across jurisdictions, with preferences for ‘Reduced Threat’ at 47 per cent, ‘Reduced Risk’ at 33 per cent and ‘All Clear’ at 20 per cent (Figure 7).
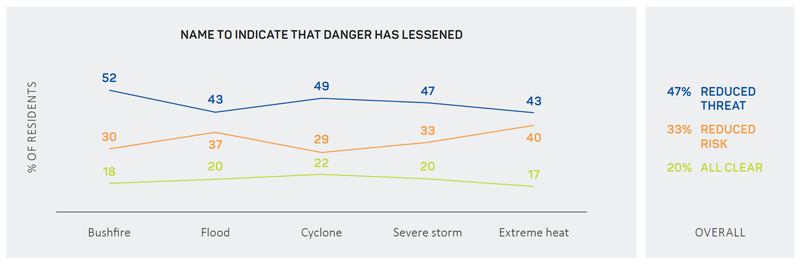
Figure 7: Preference for warning name to indicate that danger has lessened (2019, n=5408, ±1.33 per cent at 95 per cent confidence).
Preferred supporting messages
Preferences for supporting messages were not definitive, but action-orientated statements were preferred with immediate action the focus for emergency warnings. Up to 8 supporting messages were tested in Stage 3 using a variety of scenarios, hazards and warning levels. Only bushfires, cyclones and floods were tested given that previous study results indicated that participants did not think a 3-stage system was relevant to extreme heat and extreme weather hazards. There were no clear preferences for exact wording of the supporting messages given the wider selection, but action-based rather than information-based messaging was preferred. Over half of the participants preferred ‘Stay alert’ (59 per cent), ‘Leave immediately’ (52 per cent), ‘Prepare for a (Category 2) cyclone in your area’ (51 per cent) and ‘Seek shelter immediately’ (67 per cent) (see Table 4). Preference for ‘Stay Alert’ was consistent across all jurisdictions for the Level 1 bushfire scenario, except for Tasmania where there was a significantly greater preference for ‘Keep up to date’ (53 per cent). Preferred messaging referenced ‘Preparation’ in the Level 2 cyclone scenario and ‘Immediate action’ in Level 3 emergency warnings scenarios, with ‘Leave immediately’ (Level 3 flood evacuation) and ‘Seek shelter immediately’ (Level 3 bushfire, shelter in place) consistently the most preferred across all jurisdictions.
Table 4: Top 3 preferred supporting messaging for bushfire, cyclone and flood warnings (2019).
| Level 1 Warning | Level 2 Warning | Level 3 Warning (evacuation) | Level 3 Warning (shelter in place) bushfire | ||||
| Bushfire | Cyclone | Flood | Bushfire | ||||
| Stay alert | 59% | Prepare for a Category 2 cyclone in your area | 51% | Leave immediately | 52% | Seek shelter immediately | 67% |
| Stay informed | 51% | Make your cyclone preparations now | 50% | Take action now | 49% | Go to a safe place now | 57% |
| Be aware | 41% | Prepare for cyclone impact | 46% | Leave now | 44% | Immediate danger | 50% |
| Keep up to date | 40% | Prepare your home | 40% | Prepare to leave | 38% | It is too late to leave | 40% |
| Conditions may change | 37% | Prepare to leave | 36% | Prepare for flood impact | 38% | Seek shelter now | 39% |
| A fire has started | 36% | Get ready to leave | 32% | Make your flood preparations now | 33% | Take cover | 27% |
| Take care in the area | 35% | Get ready now | 29% | Increasing flood risk | 24% | Move indoors now | 21% |
| Conditions are changing | 17% | Get ready now | 22% | ||||
Note: Weighted variable for national reporting, base n=5408, effective sample size=3839 (71 per cent).
Use of action statements
Action statements are likely to promote action regardless of the hazard. Stage 4 findings demonstrated that the addition of a supporting action statement in the warning was likely to result in action among two-thirds of respondents, regardless of the hazard (see Figure 8). The remaining third of participants indicated that the inclusion of an action statement had little impact on their likelihood to act, noting that this may include people already taking action. Positively, less than 2 per cent of participants felt that an action statement would make them less likely to take action.
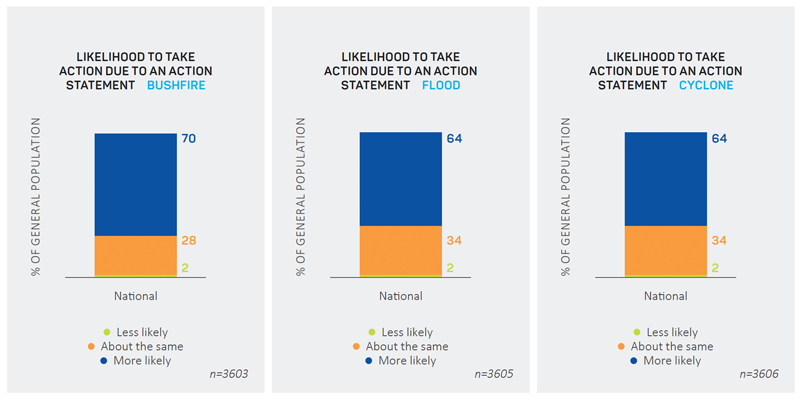
Figure 8: Likelihood to take action due a bushfire, flood or cyclone warning message with a supporting action statement (2020, n=5407 ±1.33 per cent at 95 per cent confidence).
Preferred action statement
‘Watch and Act’ is the definitive preference for the name of the middle level. In Stage 4, the top 2 names for Level 2 (the middle level) identified in Stage 3 were tested for definitive community preference. Overall, ‘Watch and Act’ was the preferred name for the middle level in a nationally consistent 3-tiered warning system, being most preferred for both escalating and de-escalating scenarios across all hazards (Table 5). Among those who had to choose a definitive preference (due to their preference changing between hazards), preference was split. In overall preference, two-thirds (65 per cent) preferred ‘Watch and Act’, compared to ‘Act Now’ (35 per cent). Across jurisdictions the preference for ‘Watch and Act’ was also clear, with participant preferences at 61 per cent (Northern Territory), 63 per cent (Tasmania and South Australia), 64 per cent (New South Wales), 66 per cent (Queensland and Victoria) and 69 per cent (Australian Capital Territory).
Given earlier findings that over two-thirds of participants were confused by the term ‘Watch and Act’ in its current use, deciding on a targeted action statement in a nested warning system to decrease barriers to comprehension (see Greer et al. 2020b) will be essential for an effective warning system.
Table 5: Preference for warning names in escalating and de-escalating scenarios for bushfire, flood or cyclone (2020, n=5407 ±1.33 per cent at 95 per cent confidence).
| Watch and Act | Act Now | |
| Bushfire | ||
| Escalating Scenario Name Preference | 62% | |
| De-escalating Scenario Name Preference | 74% | 26% |
| Definitive Preference Regardless of Scenario by Switchers* | 55% | 45% |
| Definitive Preference Regardless of Scenario - Bushfire | 70% | 30% |
| Flood | ||
| Escalating Scenario Name Preference | 54% | 44% |
| De-escalating Scenario Name Preference | 67% | 33% |
| Definitive Preference Regardless of Scenario by Switchers* | 65% | 35% |
| Definitive Preference Regardless of Scenario - Flood | 66% | 34% |
| Cyclone | ||
| Escalating Scenario Name Preference | 53% | 47% |
| De-escalating Scenario Name Preference | 58% | 42% |
| Definitive Preference Regardless of Scenario by Switchers* | 61% | 39% |
| Definitive Preference Regardless of Scenario - Cyclone | 59% | 41% |
* Percentage of general population who switched preferences
Conclusion
This study provides statistically robust evidence to inform the development of a new national warning system. Findings demonstrate that the perceived complexity of current warning systems leads to reduced awareness, a lack of comprehension and people not undertaking desired behaviours. Unless this situation changes, it is highly unlikely that positive shifts in behaviour will occur when a community receives a warning message.
This study showed that, to be effective, a warning system needs to be applied consistently across hazard types in a tiered 3-level system with simple and consistent naming combined with action-orientated messaging. A Level 3 warning name of ‘Emergency’ and ‘Watch and Act’ was the definitive preference for the name of the middle level. The most effective visual design is a triangle shape with sharp corners, a hazard-specific icon that visually increases in severity as the warning type increases, an icon design that is realistic and a colour set of yellow, orange and red.
This study highlights it is critical that emergency services organisations adopt community language in hazard messaging to improve community safety outcomes. Using a community voice builds credibility and trust and helps people to recognise their personal risk and how to respond to reduce that risk.