This summer’s Australian bushfire crisis has stirred commentary around disaster mitigation investments and their efficacy. The Australia Government recently released a National Disaster Risk Reduction Framework with a key priority being accountable decision-making.
The National Disaster Risk Reduction Framework1 includes a strategy to identify the highest priority disaster risks and mitigation opportunities. The strategy is based on the principle that it is not possible to reduce all identified risks and that investments must be targeted to minimise risks with the greatest potential effects.
The Australian Prudential Regulation Authority also outlined the importance of mitigation investment in increasing insurance affordability across north Australia. With billions of dollars of public monies invested in disaster recovery and the growing recognition of the need to adapt to climate change, a sound understanding of disaster risk is critical.
Catastrophe-loss models can be used to understand the relative risk profile of Australia. Catastrophe-loss models are decision-support systems used extensively in the (re)insurance industry to assist in pricing risk and aggregate exposure management.
Risk Frontiers developed a suite of Australian probabilistic catastrophe-loss models to quantify the impacts of flood, bushfire, hail, tropical cyclones and earthquake on Australian communities. These loss models have national coverage and are comprised of hazard, exposure and vulnerability modules. The models provide scientifically based damage estimates that can be used to rank the risk profiles of different communities nationally.
To identify the areas of Australia that pose the greatest risk of financial loss to insurable assets (residential and commercial property) the full suite of Risk Frontiers catastrophe models (hail, flood, tropical cyclone, earthquake and bushfire) were used to calculate average annual losses (AAL) for Australian postcodes based on exposure information derived from the NEXIS database. The AAL is defined as the sum of all losses divided by the number of years simulated. Figure 1 illustrates the results of the analysis. The top 20 priority postcodes across Australia are identified and listed in Table 1.
All the highest rated postcodes are in Western Australia, Queensland or New South Wales. The most significant perils are flood and cyclone. Bundaberg (4670) is rated as the postcode with the highest AAL relative to other postcodes and its total AAL contributes 0.02 per cent of Australia’s overall total AAL.
Postcodes were chosen to best represent Australian towns and suburbs. Results will vary depending on the loss metric used, for example a return period, AAL or probable maximum loss. They also vary depending on the geographic boundaries used, for example postcode, statistical area, local government area or electoral boundary. Using postcodes ignores potential losses attributable to regional scenarios. For example, potential losses due to flooding in the Hawkesbury Nepean Valley in New South Wales are greater than just the postcode of Windsor and are regarded as the greatest nationally by the insurance industry. Such comparisons of other scenarios should be considered in future analysis.
Understanding Future Risk
Risks are likely to change into the future due to climate change and urban development. Future mitigation investment decisions should consider this. Given that the catastrophe-loss modelling framework can consider changes in hazard, exposure and vulnerability, it is ideally suited to analyse influences on future risk such as climate change, mitigation investment, increased development and changes to building codes.2
The catastrophe-loss modelling outputs provide a level of strategic insight into relative disaster risks across Australia. Future investment in disaster mitigation and climate change adaptation must be evidence-based and consider all possible hazards. This will mean looking beyond the recent bushfire crisis and developing a blueprint for future investment consistent with the risk profile of Australia.
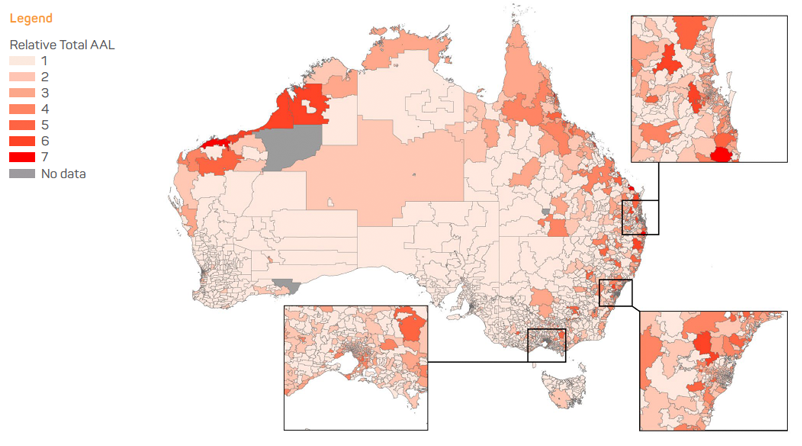
Figure 1: Australia’s Natural Hazards Risk Profile.
Table 1: Australia postcodes ranked based on total average annual loss including damage from flood, bushfire, cyclone, earthquake and hail.
| Rank | Postcode | Postcode description | State | Most significant peril |
| 1 | 4670 | Bundaberg | Queensland | Flood |
| 2 | 2480 | Lismore | New South Wales | Flood |
| 3 | 4870 | Cairns | Queensland | Cyclone |
| 4 | 6714 | Karratha | Western Australia | Cyclone |
| 5 | 4106 | Rocklea (Brisbane) | Queensland | Flood |
| 6 | 6722 | South Headland (Port Headland) | Western Australia | Cyclone |
| 7 | 4740 | Mackay | Queensland | Cyclone |
| 8 | 4305 | Ipswich | Queensland | Flood |
| 9 | 2460 | Grafton | New South Wales | Flood |
| 10 | 4814 | Townsville (western suburbs) | Queensland | Cyclone |
| 11 | 6718 | Roebourne (near Karratha) | Western Australia | Cyclone |
| 12 | 4650 | Maryborough | Queensland | Flood |
| 13 | 6725 | Broome | Western Australia | Cyclone |
| 14 | 4306 | Western suburbs of Brisbane | Queensland | Flood |
| 15 | 2756 | Windsor / Pitt Town / McGraths Hill | New South Wales | Flood |
| 16 | 6728 | Derby | Western Australia | Cyclone |
| 17 | 6721 | Port Headland | Western Australia | Cyclone |
| 18 | 6720 | Wickham | Western Australia | Cyclone |
| 19 | 4818 | Townsville (eastern suburbs) | Queensland | Flood |
| 20 | 4810 | Townsville (surrounding suburbs) | Queensland | Cyclone |