In Australia, the perception of large continental-scale dust storms has traditionally been restricted to aspects of ‘inconvenience’ or ‘novelty’. However, as the climate changes, there is an increased likelihood of dust storm activity that puts communities at increased risk. The aim of this study was to explore the need and possibility of developing a dust early warning system for Australia. Through a scoping review of internationally used sand and dust early warning systems, we found that an array of systems exist or were theoretically tested in the Northern Hemisphere. The sensor networks, one of which was operational, were of particular interest because Australia already has an operational air quality network that could be expanded to a dust early warning system. The need for a trans-boundary system is critical for Australia and, therefore, requires a combined approach of expanded sensor network with satellite-based systems to increase validation of any future modelling approach. This improved understanding could inform the development of a dust warning system for multi-socio-economic factors that account for cumulative exposure to small, localised and large continental-sized dust events.
Introduction
Significant amounts of dust are emitted and transported across the globe each year, with values ranging from 29.1 Tg/yr (Chappell et al. 2023) to 1877 Tg/yr (Tanaka and Chiba 2006). Each year, Australia contributes around 6–20% to the global dust budget1 and is the biggest dust emitter in the Southern Hemisphere (Tanaka and Chiba 2006; Chappell et al. 2023). Dust from Australia’s arid and semi-arid interior, such as the Lake Eyre Basin, is transported eastward across the highly populated southeast regions and northward across Queensland (see Figure 1) (McGowan and Clark 2008; O’Loingsigh et al. 2017).
The distance that dust is transported is crucial to distant communities due to the size of the dust particles (Tozer and Leys 2013). Dust storms close to the entrainment source are coarser than those thousands of kilometres from the source. In Australia, urban communities have been affected by dust storms dominated by fine PM10 and <PM2.52 particles, both of which are known to affect respiratory health. In addition, weather conditions at the coast deposits the sediment and organic material carried in dust storms (Pye 1987). The combination of populations residing on the coastal fringe of large arid/semi-arid regions makes eastern Australian communities exposed to dust storms (Tozer and Leys 2013).

Figure 1: Australian dust transport pathways have traditionally presented dust storms moving across 2 pathways, southeast Australia and northwest Australia.
Source: modified from McGowan and Clark (2008)
Dust storm effects
Health
Respiratory health is the greatest concern associated with dust storms. Dust from China has been found to cause conjunctivitis outbreaks in Taiwan (Lien et al. 2013) and increased hospital admissions due to respiratory illness (Ma et al. 2016), leading to respiratory mortality (Díaz et al. 2017). Research in Australia by Rutherford et al. (1999) examined the effects of dust on human health that found that frequent dust events were associated with increased severe asthma in Brisbane between 1992 and 1994. The health implications of subsequent individual dust events throughout the 2000s (Aragnou et al. 2021) supported these early findings. During the large 2009 dust storm, Brisbane Hospital emergency department admissions increased by 39% (Aragnou et al. 2021). To date, most studies in Australia exploring the effects of dust on human health have been limited to a single city or a single dust event. Thus, there is limited information on the long-term spatial patterns and trends of dust events with respiratory health.
Economic
The economic context related to dust storms is often studied based on a singular dust storm event. Significant soil loss, commodity and infrastructure destruction, disruption to communities and societal function occur across the dust transport corridor (Tozer and Leys 2013). The September 2009 dust storm in Queensland was estimated to cost nearly $300 million, with the largest costs being reported as cleaning ($254.8 million), transport disruption ($10.8 million), absenteeism ($7.5 million) and fire alarm call outs ($189,000) (Tozer and Leys 2013). Improved monitoring and increased documentation of dust events will provide increased knowledge of the economic consequences of dust storm activity.
Climate and environment
Changes in climate affect dust storm frequency (Sharratt et al. 2015). Projected changes in rainfall patterns are expected to result in some regions becoming drier, reducing vegetation cover and increasing the vulnerability to erosion (Huang et al. 2020). Land management will need to adapt to avoid accelerating these conditions (Geist and Lambin 2004). Land managers who are unaware or who do not adapt will put vegetation cover under greater pressure and may accelerate low-cover conditions and increase the risk of erosion (Leys et al. 2023; McTainsh et al. 2011). Spatial and temporal changes in heat waves and droughts requires communities, especially in rural and remote areas, to be alert and adaptive. Vegetation cover must be kept above regional target levels to reduce the exposure of soil to wind erosion (Yang et al. 2022). In Australia, these ground cover targets are described as 50% ground cover (Leys 1999). Throughout the arid/semi-arid regions, active decision-making and being responsive to environmental conditions is required to reduce these risks.
Emergency services delivery
The 2009 dust storm grounded a significant number of Queensland air medical retrieval aircraft for 20 hours due to low visibility, high turbulence and risk of damage. Any disruption to emergency services delivery during dust storms could be critical to human life (Holyoak, Aitken and Elcock 2011). Sand and dust storms also affect the signal attenuation of telecommunications systems, which can be avoided by using a dust attenuation parameter and supplying extra power during major dust storms (Harb, Abdillah and Abdul-Jauwad 2014).
Understanding risk
Australia has a long history of dust activity and is a significant global contributor of dust. Climate change forecasts predict future dust activity to increase. This increases risk to human populations and societal functions. Both the Sendai Framework for Disaster Risk Reduction 2015-2030 and the United Nations Convention to Combat Desertification emphasise the value of having ‘the availability of and access to multi-hazard early warning systems’ (UNDRR 2015, p.12) and ‘sand and dust storm early warning systems’ (UNCCD 2022) as a priority to build resilience against dust.
Australia has the Australian Warning System3, which provides consistency in warning language and cross-boundary coordination. The system is a multi-hazard early warning system but has no specific reference to a dust early warning system (AIDR 2021). Given dust storms often occur with other hazards, for example dust storms and bushfires in 2002 (McTainsh et al. 2005) and 2019 (Aragnou et al. 2021), there is merit in identifying what parameters are required to include a dust early warning system in Australia.
This research scoping review explored the international literature of sand and dust storm early warning systems globally to understand how achievable it might be for Australia to develop and incorporate a meaningful dust early warning system.
Methodology
A scoping review is a method to quickly investigate, summarise and convey research findings compared to a systematic review (Arksey and O’Malley 2005). This scoping review explored the international literature to identify:
- the early warning sand and dust detection systems that are in operation or have been tested
- the general descriptions of how those systems operate
- if the systems are transboundary
- what risks and hazards effects are considered in the purpose for the system.
To identify relevant studies, 4 databases (Web of Science, Scopus, JSTOR and Bibliography of Aeolian Research) were searched using the terms: ‘warning system’ OR ‘alert system’ OR ‘detection system’ AND ‘dust’ OR ‘sand’ OR ‘SDS’ OR ‘multi-hazard’ OR ‘particulate matter’ OR ‘PM’. Only papers published between January 2000 and December 2022 in English were included. The papers were imported into an EndNote referencing system for the next stage of exclusion and analysis (see Figure 2).
The titles and abstracts of compiled papers were screened using exclusion criteria:
- The paper does not describe or test an early warning system.
- The paper does not include a focus on sand and/or dust.
- An early warning system is a suggestion to a problem.
- The early warning system is for aviation, coal mines or indoor only.
- The paper was a systematic review of some form.
It is acknowledged that there might be operational dust early warnings performed by government agencies where publicly accessible content is limited. Searching for government reports (grey literature) was performed using search tools (Google, Elicit, institutional website search tools) with very limited results and those identified provided limited analysable content. International cases, if available, might also be presented in the local language. These considerations limit the breadth of the international results, especially of operational early warnings systems. However, it is expected that results from this review will prove meaningful in the context of evaluating different types of sand and dust storm early warning systems that exist or are being developed.
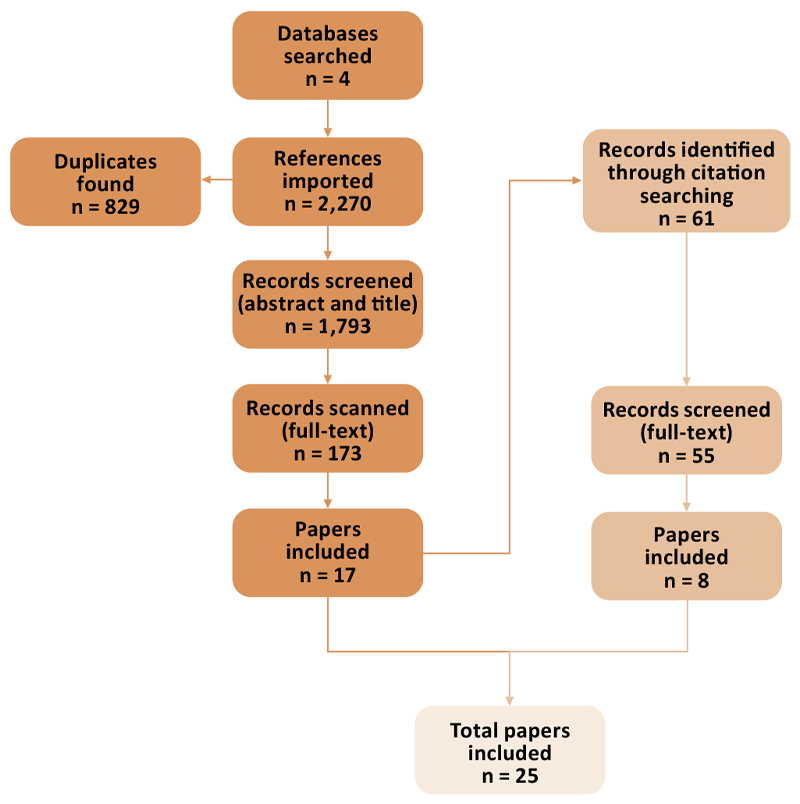
Figure 2: The process to identify papers for the scoping review included searching 4 databases, screening abstracts and titles and screening the full text.
Features of the studies
There were 25 papers between 2000 and 2022 that presented sand and dust early warning systems (Figure 3). Geographically, the majority of these papers existed in China (n=7), which aligns with the understanding that China is significantly affected by sand and dust storms that develop from the Taklimakan and Gobi deserts (Tanaka and Chiba 2006). Taiwan (n=3) and America (n=3) were the next most common case studies (Table 1). Interestingly, all 3 studies from Taiwan were localised to rivers or cities near rivers. All case studies were in the Northern Hemisphere, which aligns with the larger populations affected by these storms compared to the Southern Hemisphere. The majority of papers published in 2022 (the year with most publications (n=5)) came from the Middle East perhaps related to the increased dust storm frequency in that area (Rashki, Middleton and Goudie 2021).
Table 1: The regions where sand and dust early warning systems have been tested or operate.
| Region | Number | Authors |
| China | 7 | Kim et al. (2011); Gong and Zhang (2008); Zhou et al. (2008); Jin et al. (2018); Gao and Han (2010); Zhang et al. (2009); Hu et al. (2004) |
| Taiwan | 3 | Nguyen et al. (2021); Lin et al. (2016); Chuang et al. (2016) |
| America | 3 | Sprigg et al. (2014); Yin et al. (2005); Nickovic et al. (2001) |
| Iran | 2 | Goudarzi et al. (2022); Mirzadeh et al. (2022) |
| South Korea | 2 | Hahm & Yoon (2021); Zhou et al. (2008) |
| Romania | 1 | Adam et al. (2022) |
| Italy | 1 | Chianese et al. (2019) |
| Qatar | 1 | Fountoukis et al. (2022) |
| India | 1 | Ghude et al. (2020) |
| Japan | 1 | Zhou et al. (2008) |
| Saudi Arabia | 1 | Akhlaq et al. (2012) |
| Middle East and North Africa | 1 | Rostkier-Edelstein et al. (2022) |
| Europe and Middle East | 1 | Martínez et al. (2009) |
| Atlantic Ocean | 1 | Ansmann et al. (2017) |
| Undefined | 1 | Al Murayzig et al. (2016) |
Note: Some early warning systems were transboundary so an author may be cited more than once. The early warning system described in Al Murayzig et al. (2016) is a hypothetical system and was not operationally nor theoretically tested using data and, therefore, is not constrained geographically.
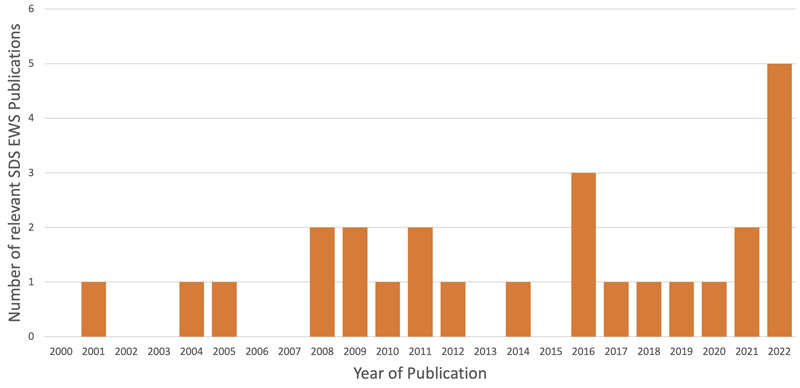
Figure 3: The spread of publications describing sand and dust early warning systems reviewed from 2000 to 2022.
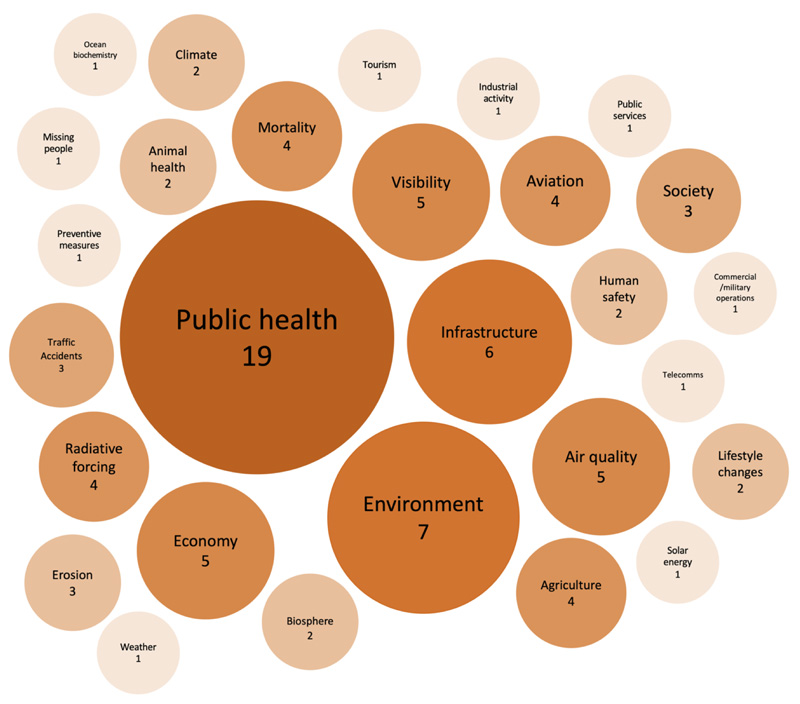
Figure 4: The frequency of sand and dust storms effects considered within the papers analysed.
Overwhelmingly the early warning systems studied aimed to reduce public health effects (n=19), with a particular focus on the respiratory and cardiovascular conditions caused by dust particles. Some acknowledgment was given to increases in hospital admissions and medical costs. The next most cited effects (n=7) were environmental factors, followed by infrastructure (n=6) and the economy (n=5) (see Figure. 4). These results were expected as they pose the most immediate threat to large populations exposed to continental-scale sand and dust storms (Goudie 2014). This is mirrored in the Australian context, with the dust storms of 1983, 2009 and 2019 studied through an environment lens (Raupach, McTainsh and Leyset 1994), the economy (Tozer and Leys 2013) and health (Aragnou et al. 2021).
A total of 30 sand and dust storm early warning systems were covered in the 25 papers. Of these systems, 8 are/were operational, 19 were theoretically tested and 1 was an untested hypothetical system (see Table 2). Of the operational systems, 6 were models and 2 were sensor networks. The 2 operational sensor networks were published in 2021 (Hahm and Yoon 2021) and 2022 (Adam et al. 2022), while operational model systems span from 2008 onwards.
| Type | System | Status | Number | Authors |
| Sensor Network | Photometer | Operational* | 1 | Adam et al. (2022) |
| Sensor Network | Theoretically tested | 1 | Akhlaq et al. (2012) | |
| Operational | 1 | Hahm and Yoon (2021) | ||
| Satellite Images | Theoretically tested | 1 | Martínez et al. (2009) | |
| Machine Learning | Artificial Neural Network | Theoretically tested | 5 | Chianese et al. (2019); Goudarzi et al. (2022); Nguyen et al. (2021); Mirzadeh et al. (2022); Chuang et al. (2016) |
| Operational | 1 | Al Murayzig et al. (2016) | ||
| Adaptive Neuro Fuzzy Interference System | Theoretically tested | 1 | Mirzadeh et al. (2022) | |
| Support Vector Regression | Theoretically tested | 2 | Mirzadeh et al. (2022); Zhang et al. (2009) | |
| Statistical | Regression Analysis | Theoretically tested | 2 | Lin et al. (2016); Gao and Han (2010) |
| Historical Analysis | Theoretically tested | 1 | Hu et al. (2004) | |
| Regional Climate Models | CUACE | Operational | 2 | Gong and Zhang (2008); Zhou et al. (2008) |
| DREAM | Theoretically tested | 2 | Yin et al. (2005); Sprigg et al. (2014) | |
| Operational | 1 | Nickovic et al. (2001) | ||
| WRF-Chem | Theoretically tested | 2 | Fountoukis et al. (2022); Rostkeir-Edelstein et al. (2022) | |
| Operational | 1 | Ghude et al. (2020) | ||
| CFORS | Operational | 1 | Kim et al. (2011) | |
| ADAM | Operational | 1 | Kim et al. (2011) | |
| SKIRON | Theoretically tested | 1 | Ansmann et al. (2017) | |
| MACC/CAMS | Theoretically tested | 1 | Ansmann et al. (2017) | |
| LOTOS-EUROS/Dust | Theoretically tested | 1 | Jin et al. (2018) | |
| NMMB/BSC-Dust | Theoretically tested | 1 | Ansmann et al. (2017) |
* ‘Operational’ means operational at the time of the study and not necessarily operational at present.
Thematic findings
Sensor networks as early on-ground detectors
Aerosol monitoring networks use a range of instruments, PM2.5, PM10, TSP, TEOM, nephelometers, sun photometers and ceilometers to estimate aerosol concentration. Recording and reporting frequency varies depending on the intent of the monitoring network. Regardless of the sensor type, there is a benefit to an early warning system having a sensor network as an on-ground early detector. Hahm and Yoon (2021) describe an advanced sensor network that consists of over 600 aerosol (PM2.5) monitoring stations across South Korea. This monitoring network strengthens predictions, both spatially (easier to pinpoint source and movement) and temporally (more likely to signal early detection due to the high density of sensors) with different designations of warning areas. PM2.5 concentration thresholds are set for different risk and warning levels and are sent via text message (Hahm and Yoon 2021). The authors found that this system reduced hospital visits and admissions for dust-related issues during dust-heavy days. This indicated an effectiveness as a risk reduction mechanism (Hahm and Yoon 2021).
Akhlaq, Sheltami and Shakshuki (2012) combined satellite derived (METEOSAT) red, green and blue composites to detect dust events with a network of meteorological parameters (e.g. wind speed, temperature, humidity) to forecast dust transport and deposition. This system can alert for 3 types of dust storms (severe, short-term and small-scale, long-term and large-scale) dependent on the spatial/temporal sensitivity of the sensor network and/or satellite. Adam et al. (2022) integrated sensor networks consisting of ceilometers, sun photometer and AERONET with HYSPLIT back trajectory modelling and aerosol optical depth data. Ceilometers detect other aerosols such as smoke, fog and anthropogenic particulates that require careful quality control to ensure accuracy in the early warning system. The study identified several negatives of the system including availability of AERONET data, the ceilometer only detecting aerosols up to a certain height, spatial availability of sun photometer data, need of internet access and errors in running the HYSPLIT model (Adam et al. 2022).
Artificial neural networks
Use of an Artificial Neural Network (ANN) as an early warning system has occurred since 2016 given their simplicity of use, limited data input requirements and reduced computing power compared to deterministic models (Chianese et al. 2019). Despite the popularity of the system as an early warning system, none of the ANN systems included in this review were operational. Two operational challenges exist: network bias occurring from low spatial resolution of the monitoring network and/or an ANN system that is geographically dependent. While monitoring density is considered important to reduce bias, no definition of an adequate density was stated in any of the papers reviewed related to ANNs. For example, despite the low number of stations used in the studies of Goudarzi et al. (2022), 4 stations across 530 km2 and Mirzadeh et al. (2022), 3 stations across 2,491 km2, the accuracy of the forecasting was not considered compromised. The large monitoring area required in Australia makes it difficult to extrapolate these studies from the Northern Hemisphere. Bias associated with geography can be associated with the proximity of monitoring stations to urban areas and industrial emission hot spots (Chianese et al. 2019; Goudarzi et al. 2022) or simply the need for local geographic area calibration (Zhang, Patuwo and Hu 1998). Routinely, these were described as biases to be aware of and not constraints to operational use. So, while simple in use, the use of such systems would prove complex.
Regional climate model systems
Models make up almost half of the systems analysed in this review (n=18) and most operational systems (n=6). Given models are usually purposefully built and use historic data, this is not surprising, with many of the models being operational since the mid-2000s. Across the models, data inputs generally consist of vegetation cover, soil moisture, turbulent mixing processes and aerosol interactions. These properties can be mapped back to the process of dust emission and transportation (Opp et al. 2021), providing a broader view than a sensor network or ANN that makes predictions based on localised, current data (Zhang, Patuwo and Hu 1998). Regional climate models from the Northern Hemisphere are often transboundary, crossing country borders (e.g. Rostkier-Edelstein et al. 2022). Out of the 30 early warning systems analysed, 11 were transboundary. For a dust model to be effective as a transboundary early warning system it largely depends on the model itself (input data) and the study region(s). For example, while Rostkier-Edelstein et al. (2022) found that the WRF-Chem/RTFDDA model performed well as a theoretical early warning system that covered the Middle East and North Africa regions, Kim et al. (2011) found that their models showed dust relatively well across Japan and South Korea but not China. They conclude that dust emission and meteorological input data might be the likely cause of these results (Kim et al. 2011).
Satellites
While satellite data was commonly used as data input or for verification, only one paper used satellite data as the primary operation of the system (Martínez, Ruiz and Cuevas 2009) (some studies used satellites as secondary sources of data to support their operation (Akhlaq, Sheltami and Shakshuki et al. 2012).Martínez, Ruiz and Cuevas (2009) recognised the capability of METEOSAT to detect the development of small dust plumes and ‘subtle changes’, meaning that the development of a dust storm can be identified at its early stages and in near-real time. METEOSAT is a geostationary satellite that scans the Middle East and North Africa regions every 15 minutes (Schmetz et al. 2002). While the spatial resolution doesn’t compare to satellites such as MODIS or Landsat, it has the capacity to detect and monitor the development and transport of dust plumes (Baddock et al. 2021).
Is Australia ready?
A suite of monitoring and forecasting tools are required to be effective. While many of the reviewed sand and dust early warning systems were dominated by one tool (i.e. ANN or satellite), often multiple tools supported the early warning process. For example, Pearson coefficient4 analysis to find what meteorological parameters were important for dust storm prediction was conducted by Goudarzi et al. (2022) despite the ANN forming the core part of the forecasting system.
Australia has ground-based instrumented networks, high-temporal resolution satellite capability and locally developed wind erosion models ready for tuning to forecasting. The Dust Watch Network5, established in 2002, is a cross-jurisdictional citizen-science project to monitor dust activity in southeast Australia. It hosts over 40 monitoring stations across rural and remote New South Wales, Victoria and South Australia (Leys et al. 2008). Riley (2021) also described the New South Wales air quality network that send automatic alerts to registered people via email or SMS, providing information about actions to take. This network is multi-hazard and send alerts for dust, smoke and other pollutants, however, it is region-specific to New South Wales. The rural locations of the instruments make this network highly relevant as an early warning system because early detection of dust before the plumes reach downwind urban centres is advantageous (Opp et al. 2021) and the coastal network of air quality monitors extends that capability (Riley 2021).
Akhlaq, Sheltami and Shakshuki (2012) took advantage of both a sensor network and red, green and blue satellite images to form a warning system in Saudi Arabia for different types of sand and dust storms. Similarly, the operational network system in South Korea (Hahm and Yoon 2021) uses over 600 aerosol monitors (covering an area of 100,210 km2) to feed into regional modelling and creating it’s early warning system network. Although the current Australian dust monitoring network is essentially spatially constrained to New South Wales, the rural position acts as an early detection system to trigger use of the high-temporal satellite monitoring. Critically, the rural positioning of current instruments informs an early warning system for large dust storms that commonly affect Australia’s eastern cities (Strong et al. 2011; Baddock et al. 2015).
The Korea Meteorological Administration (KMA) operates a dust early warning system under the Regional Data Assimilation and Prediction System aided by ground observations (KMA n.d.). The KMA issues an ‘advisory’ warning when PM10 > 400 μg/m3 and an ‘Asian Dust’ warning when PM10 > 800 μg/m3 (KMA 2016). The latter warning urges people to stay inside, especially children and those with respiratory issues, as well as the rescheduling of outdoor activities (KMA n.d.). The Japan Meteorological Agency forecasts dust through the Model of Aerosol Species in the Global Atmosphere (MASINGAR), which takes into account the physical processes of dust storm formation and transportation. The KOSA website6 provides forecasts of dust in advance of 96 hours and alerts are communicated via the website (Mikami, Maki and Tanaka 2009).
Australia is expansive and has dust storm events that occur regionally through to scales that cross multiple states. The sand and dust storm early warning systems analysed in this review that use satellite data have only been tested or operationalised in countries far smaller than Australia. The study by Martínez, Ruiz and Cuevas (2009) demonstrated the capability of satellites to detect early development of dust storms across large areas. While METEOSAT does not operate over Australia, an almost 1:1 comparative satellite does. Himawari-8 (H-8), launched and operated by the Japan Meteorological Agency, scans the Asia-Pacific region every 10 minutes at a spatial resolution of 1–2 km (Bessho et al. 2016). The advantage that H-8 offers is the spatial and temporal coverage it can provide to detect the development of dust storms, especially during the night using thermal infrared bands (Bessho et al. 2016).
Modelling dust emission and transport across Australia has been conducted using models underpinned by datasets and physical and chemical processes. The Computational Environmental Modelling System relies on climate and vegetation data to estimate dust loss (Shao et al. 2007). Chappell et al. (2023) used an albedo-based model to estimate surface roughness controls of dust emission and transport globally, including across Australia. The WRF-Chem has been used in Australia to research dust transport (Aragnou et al. 2021; Nyugen et al. 2019) using global aerosol and saltation schemes. The different approaches used between these 3 models present an opportunity for a transboundary early warning system, particularly if calibrated with monitoring network- and satellite-source detection. Thus, H-8 or model-based early warning systems that have been tested over regions as expansive as Australia would be more suitable for the establishment of a dust early warning system for Australia.
Conclusion
This research makes a case for the development of an Australian dust early warning system through a scoping review of international systems, both theoretical and operational, and the consideration of the applicability of such systems in Australia. Sand and dust early warning systems have been tested and applied primarily in the Northern Hemisphere, with more model systems operationalised compared to non-model systems. The systems analysed use a range of tools to inform the early warning system being ground-based sensor networks, remote sensing aerosol detection, modelling and statistical approaches. Many global examples combine a number of techniques to build locally sensitive systems. Australia has a range of tools relevant to building an early warning system, albeit disparate and built for alternative purposes. The New South Wales air quality network incorporates the rural and remote network of DustWatch. The geographic position of these instruments provides crucial input data to trigger the use of high-temporal resolution satellite monitoring. It is recommended that a transboundary Australian multi-hazard early warning system that accommodates dust detection be established through a combination of rural dust monitors and satellite monitoring. Investment to expand the instrumented networks across state borders, along with cross-boundary data management, would need to occur to build a transboundary dust early warning system. This development could reduce risks to people’s health as well as the effects on the economy and communities, especially in a changing environment and climate.