Since 2001, approximately 45 per cent of all flood fatalities in Australia are attributed to people entering floodwater in motor vehicles. This behaviour is considered high-risk and avoidable. However, for emergency services personnel performing their duties, there may be additional pressure to take on such risks. In Victoria, the Victoria State Emergency Service (VICSES) is the control agency for floods and storms and its personnel encounter floodwater frequently. At an organisational level, good workplace health and safety practices are fundamental and duty of care is of paramount importance. VICSES personnel are discouraged from driving through floodwater; an exception being when responding to life-threatening situations. Doing so exposes staff to personal harm and driving through floodwater in work vehicles can result in vehicle and equipment damage. There is also the potential for VICSES reputation damage if people observe VICSES personnel driving into floodwaters and not heeding safety advice to 'never drive (walk, or ride) through floodwater'. This raises public safety concerns if people take similar risks. This paper presents findings from a larger study into the circumstances in which SES personnel drive through floodwater in SES or private vehicles. Outcomes from this research will inform policy, practice and training to improve safety, keep staff and equipment safe and model good practice in communities.
Introduction
Entering floodwater is dangerous, whether in vehicles or on foot. Haynes and colleagues (2017) documented that over 1859 flood fatalities were recorded in Australia between 1900 and 2015. In recent years, approximately 45 per cent of all flood fatalities have been vehicle-related, with males in their 50s and 70s overrepresented in the fatality statistics (Ahmed, Haynes & Taylor 2020). Work-related fatalities account for a modest proportion of flood fatalities, as do those linked to professional emergency service rescuers, 12 per cent and 4.1 per cent, respectively (Coates 1999 and Coates & Haynes 2008, cited in Becker et al. 2015).
Other studies have shown that over half of all unintentional flood-related drowning deaths in the ten-year period 2004–05 to 2014–15 were a result of driving through floodwaters (Australian Water Safety Council 2016). By understanding the circumstances and motives underlying this behaviour it may be possible to identify new and improved ways to promote safer behaviour for both the general public and those in higher-risk occupations, such as emergency services.
This study forms part of a three-year research project on flood risk communication.1 This project focused on the behaviour of the public during times of flooding and sought to inform flood risk communication strategies. It was conducted in collaboration with State Emergency Services (SES) end users across all Australian states and territories.
The research reported here is a sub-study that explored the risk attitudes, behaviours and practices of SES personnel to identify the situations and the contexts in which they drive into floodwater in SES vehicles. Data were collected in four SES jurisdictions in Victoria, New South Wales, the Australian Capital Territory and South Australia. This paper reports data from Victoria only, however, study findings may support similar organisations in Australia and internationally where personnel have emergency response responsibilities in flood and storm conditions.
The VICSES is a volunteer-based emergency service organisation, with approximately 5200 volunteers and 200 employees with 149 units across Victoria. It is the control agency for flood and storm emergencies in Victoria and has the primary responsibility for planning for and responding to these (Victoria State Emergency Service 2019).
Methods
Survey design
A survey was developed in collaboration with SES end users. It was divided into sections covering general and work-related driving experience, demographics and deployment details, willingness to drive through floodwater, experiences of driving through floodwater an experiences of turning around from floodwater.
If respondents had experienced a recent event of driving through floodwater (or turning around), they were asked a series of questions about that one event. This included the type of vehicle they were in, water and road characteristics, weather, lighting, the actions of others in the vehicle, their perception of risk and factors that influenced their decision to drive through or turn around.
Administration
The survey was administered using Survey Monkey. An invitation was emailed to all VICSES staff and volunteers with a message from the Chief Officer, Operations and also promoted through internal social media channels and newsletters. Data were collected over an eight-week period from 8 April to 31 May 2019. A reminder was sent in the final week of data collection. The Macquarie University Human Research Ethics Committee granted approval for this study (Reference number: 5201700133).
Participants
At the close of the survey, 381 VICSES personnel had responded. Of these, just over three quarters (76 per cent, n=288) were male, 21 per cent were female (n=80) and the remaining 3 per cent (n=12) did not specify a gender.
The age profile of the study sample was compared to that of the organisation overall. Figure 1 shows the survey sample was generally older overall and there was significant overrepresentation of people aged 45–54 years.
The majority of the sample (89 per cent, n=323) was volunteer personnel, 5.5 per cent were career (salaried) staff (n=20), and 5.5 per cent served as both career staff and volunteers (n=21).
Just under half the volunteer respondents had a length of service more than 10 years (44 per cent, n=149), and 30 per cent (n=98) had served 5 years or less. Just over half the career staff had been in the organisation for 5 years or less (54 per cent, n=37).
The sample included personnel from all Victorian SES regions with the largest representation (41 per cent, n=150) from Central Region, which is the largest VICSES region. All respondents held a valid driving licence and 91 per cent (n=347) had approval to drive SES vehicles.
Driving through floodwater definition
The focus of this paper is the act of driving through floodwater. The definition of 'floodwater' used here relates to floodwater on a road. This was agreed to with SES end users to ensure it would be relevant for SES personnel. For the purposes of this survey, ‘floodwater’ is defined as an environment with:
- water across the road surface
- little to no visibility of the road surface markings under the water (i.e. uncertainty of road quality/integrity and possible depth)
- water on normally dry land (flowing or still).
Based on this, survey participants were asked to recall how many times they had driven (or been driven) through floodwater in the last two years in an SES vehicle. Responses were ‘never’, ‘1–2 times’, ‘3–6 times’ and ‘more than 6 times’. Participants were asked to recall a situation in which they had driven (or been driven) through floodwater. Ideally, this would be their most memorable experience in the last few years.
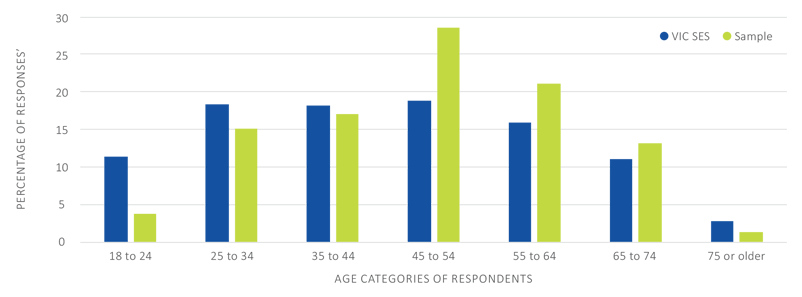
Figure 1: Age profile of the study sample compared to the VICSES.
Analysis
Results are presented in three sections. The first section is the frequency of the act of driving through floodwater in VICSES vehicles and simple statistical analysis to explore relationships between demographic variables and driving through floodwater. The second section is a summary or 'snapshot' of the contexts and conditions in which respondents reported driving through floodwater. This includes characteristics of the water depth and flow as well as the operational context and the location. The third section explores relationships between demographic and other variables and the 'higher-risk' and 'lower-risk' situations in which respondents entered floodwater.
Although the sample size was adequate for analysis, it represents an estimated 8.2 per cent of the VICSES personnel overall (20.5 per cent of career staff and 7.2 per cent of the volunteer contingent). The statistical findings are viewed as robust but are indicative of the sample rather than representative of the organisation or similar organisations across Australia.
Results
Respondent profile
Participants were asked how many times they had driven through floodwater in an SES vehicle as a driver as well as how many times they had been driven through floodwater in an SES vehicle as a passenger in the last two years. Results showed that 41 per cent of respondents with approval to drive SES vehicles (n=140) had driven through floodwater as a driver (see Figure 2) and 39 per cent of all respondents (n=150) had been driven through floodwater as a passenger. In total, just under half of the respondents (46 per cent, n=174) had entered floodwater in the last two years as either a driver or a passenger.
Chi-square analysis was used to investigate relationships between demographic variables and the act of driving through floodwater in an SES vehicle. A selected set of these analyses is summarised in Table 1.
Table 1 shows some significant relationships identified between the independent variables and driving through floodwater. Somewhat surprisingly, there was no significant relationship with age, but there was with gender and with the length of service of volunteers. Females were less likely to have driven through floodwater, however, volunteers with increasingly greater lengths of service were more likely to have driven through floodwater in the last two years. Although not shown in Table 1, differences were identified between career staff and volunteers. The length of service of career staff did not show significant relationships with driving through floodwater.
The variables 'Get deployed in floods and storms' and 'Hours driven each week' were found to relate to driving through floodwater. Those who were not deployed in floods and storms were less likely to have driven through floodwater, while those who drove more hours per week were more likely to have driven through floodwater.
Relationships were noted between driving through floodwater in an SES vehicle and variables relating to private vehicles and the types of vehicles driven. Unsurprisingly, those who usually drive larger SES vehicles are more likely to have driven through floodwater in an SES vehicle in the last two years. One of the strongest relationships with driving through floodwater in an SES vehicle was the frequency with which respondents drove through floodwater in their private vehicle. Those who had driven through floodwater a large number of times in the last two years were also more likely to have driven through floodwater in a work vehicle. No relationship was found with the type of private vehicle usually driven. Although the raw data in Table 1 suggests that a higher proportion of those who drive a private 4WD vehicle are likely to have driven through floodwater, the overall relationship with drive operation failed, marginally, to reach the accepted threshold for statistical significance (p=0.05).
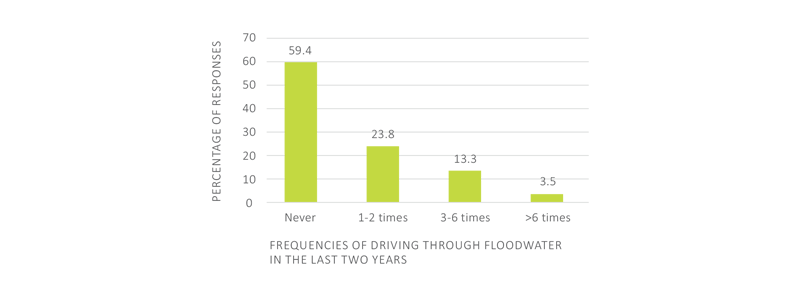
Figure 2: Frequency of driving through floodwater in an SES vehicle as a driver in the last two years (n=140).
When people drive through floodwater
To collect information about the conditions and contexts in which people drive through floodwater, survey participants were asked to recall 'the most memorable occasion in the last few years' when they drove (or were driven) through floodwater in an SES vehicle. A total of 180 (47 per cent) recalled such an event and provided the details. The timeline for this question was not limited explicitly to two years. Just over a third (37 per cent, n=66) recalled and detailed an event within the last two years, 29 per cent (n=53) recalled an event in the last 3–5 years and 33 per cent (n=60) recalled an event that occurred more than 5 years ago. Figure 3 represents a snapshot of some of the detailed information provided by respondents.
Table 1: Breakdown of demographic variables and experience of driving through floodwater in SES vehicles.
| Had driven through floodwater in the last two years (as driver) | ||||||
| Yes | No | |||||
| Independent variables | n | % | n | % | total | χ2 (P value) |
| Gender | ||||||
| Male | 122 | 45.0 | 149 | 55.0 | 271 | 9.903 (P<0.01) |
| Female | 17 | 24.3 | 53 | 75.7 | 70 | |
| Age | ||||||
| <35 | 28 | 45.2 | 34 | 54.8 | 62 | 1.165 (P=0.884) n.s. |
| 35-44 | 24 | 41.4 | 34 | 58.6 | 58 | |
| 45-54 | 39 | 40.2 | 58 | 59.8 | 97 | |
| 55-64 | 27 | 36.5 | 47 | 63.6 | 74 | |
| 65+ | 21 | 42.9 | 28 | 57.1 | 49 | |
| Get deployed in floods and storms | ||||||
| Yes | 127 | 42.7 | 170 | 57.2 | 297 | 5.002 (P<0.01) |
| No | 12 | 25.5 | 35 | 74.4 | 47 | |
| Length of service (volunteer) | ||||||
| Up to 5 years | 23 | 25.8 | 66 | 74.2 | 89 | 22.323 (P<0.001) |
| 6-10 years | 35 | 38.9 | 55 | 61.1 | 90 | |
| 11-20 years | 41 | 47.7 | 45 | 52.3 | 86 | |
| >20 years | 37 | 63.8 | 21 | 36.2 | 58 | |
| Hours driven each week | ||||||
| <2 hours | 5 | 29.4 | 12 | 70.6 | 17 | 12.762 (P<0.01) |
| 2-7 hours | 38 | 30.9 | 85 | 69.1 | 123 | |
| 8-14 hours | 40 | 40.4 | 59 | 59.6 | 99 | |
| 15+ hours | 56 | 53.3 | 49 | 46.7 | 105 | |
| Type of SES work vehicle driven most often | ||||||
| Passenger vehicle | 22 | 26.2 | 62 | 73.8 | 84 | 18.664 (P<0.001) |
| Light truck/dual cab | 38 | 43.2 | 50 | 56.8 | 88 | |
| Medium/heavy truck | 69 | 56.1 | 54 | 43.9 | 123 | |
| Other | 10 | 37.0 | 17 | 63.0 | 27 | |
| Driven through floodwater in own private vehicle in last two years | ||||||
| Never | 31 | 21.4 | 114 | 78.6 | 145 | 54.143 (P<0.001) |
| 1-2 times | 52 | 43.7 | 67 | 56.3 | 119 | |
| 3-6 times | 36 | 72.0 | 14 | 28.0 | 50 | |
| >6 times | 20 | 71.4 | 8 | 28.6 | 28 | |
| Own private vehicle (drive operation) | ||||||
| 2-wheel drive (2WD) | 57 | 37.0 | 97 | 63.0 | 154 | 5.641 (P=0.06) n.s. |
| 4-wheel drive (4WD) | 61 | 49.6 | 62 | 50.4 | 123 | |
| All wheel drive (AWD) | 21 | 35.0 | 39 | 65.0 | 60 | |
Events reported by respondents comprised a combination of characteristics. Although Figure 3 amalgamates these, this 'snapshot' is a useful summary of situations where SES personnel in vehicles entered floodwater. An image of a car (bottom right, Figure 3) was used in the survey to provide a reference for respondents and help bring consistency to responses about floodwater depth in centimetres. Most events reported involved entering shallow water (60 per cent in 30 cm or less) although 12 per cent of respondents estimated water depth deeper than 60 cm. Water flow was typically still or slow. Most incidents as reported took place in rural locations and in 4WD vehicles (69 per cent). The weather was typically clear or with only light rain. Two-thirds took place in daylight (good light) and 14 per cent occurred at night with no street lighting. Most events occurred on highways or major roads (43 per cent) or minor, residential roads (44 per cent) and 89 per cent on a 'normal stretch' of road, rather than a low-water crossing, bridge, or causeway (9 per cent). There was no signage in 74 per cent of events, although road closure signs were reported in 13 per cent, and flood warning signage in 8 per cent.
Events rarely took place with only one driver in the vehicle. In most events, the other occupants were SES colleagues (91 per cent). Passengers were reported to have influenced the decision to drive through floodwater in 31 per cent of events. In 88 per cent of events, it was reported that others in the vehicle felt similarly about the level of risk of driving through the floodwater. Forty-seven respondents provided free text (unguided) comments about the interactions with passengers at the time of the event. In more than half the text comments there was reference to discussions between vehicle occupants and agreement to continue through the floodwater. Seven respondents mentioned actions taken to assess the risk, such as walking through the water or conducting a dynamic risk assessment. Seven respondents mentioned the urgency of the situation and their perceived operational pressure to continue. A few respondents mentioned the additional experience of other people in the vehicle who they deferred to or any lack of agreement or coercion. Quotes from respondents include:
After discussion we all agreed that we could give it a go.
I discussed with the driver whether we could make it across and we agreed we could, based on our knowledge of the area when it was dry.
The passengers were very keen on an alternative route but the driver proceeded into the flood water.
[We] Played down the danger, except for one who expressed concern, and we all, me included to my eternal shame, dismissed her concerns.
Initially the driver was encouraged to proceed, but [at the next deeper water crossing] the passengers stopped the driver who was going to keep going.
The data presented in Figure 3 shows a snapshot of the situation reported by respondents. The largest proportion of events were when respondents were undertaking an emergency response. These were occasions 'not under lights and sirens’ (61 per cent). Another 10 per cent were on routine work and 10 per cent were on emergency response 'under lights and sirens'. When there were other emergency services personnel around (in 49 per cent of the reported events), the majority (83 per cent) were also driving through floodwater. In situations where there were members of the public present (59 per cent of the reported events), 55 per cent of respondents also drove through the water and 27 per cent showed a mix of behaviours.
Higher-risk events
Considering the contexts and conditions when personnel entered floodwater some situations were, likely, more risky than others. Therefore, working with VICSES, criteria were identified that could be applied to each reported event to classify those likely to be 'higher risk'. For this analysis, entering floodwater was classified as 'higher risk' if it met any of the following criteria:
- the water was rapid or swift flowing
- the water was 95 cm or deeper
- the water was on a ford, weir or low-water crossing AND the water was deeper than 45 cm
- the water has medium or moderate flow AND was deeper than 45 cm
- the water was deeper than 30 cm AND the respondent was in an SES passenger vehicle.
These criteria were applied to the 180 provided events of entering floodwater in SES vehicles. Using these criteria 19.4 per cent of events (n=35) were designated 'higher risk' and 80.6 per cent of events (n=145) were 'lower risk'.
Chi-square analysis was used to determine relationships between the 'higher risk' events and demographic and other variables. A selected set of summary data and analysis is presented in Table 2. The sample size is very small and the analysis is indicative only.
Analysis of the higher and lower-risk events identified some relationships with demographic variables. Statistically significant relationships were found for gender and the influence of passengers. Females were more likely to report higher-risk events. On investigation, females who reported higher-risk events were also significantly more likely to have been a passenger in the vehicle. Passengers were found to influence the decision to drive through floodwater. Survey results showed a higher proportion of respondents reported being influenced by passengers in the higher-risk events.
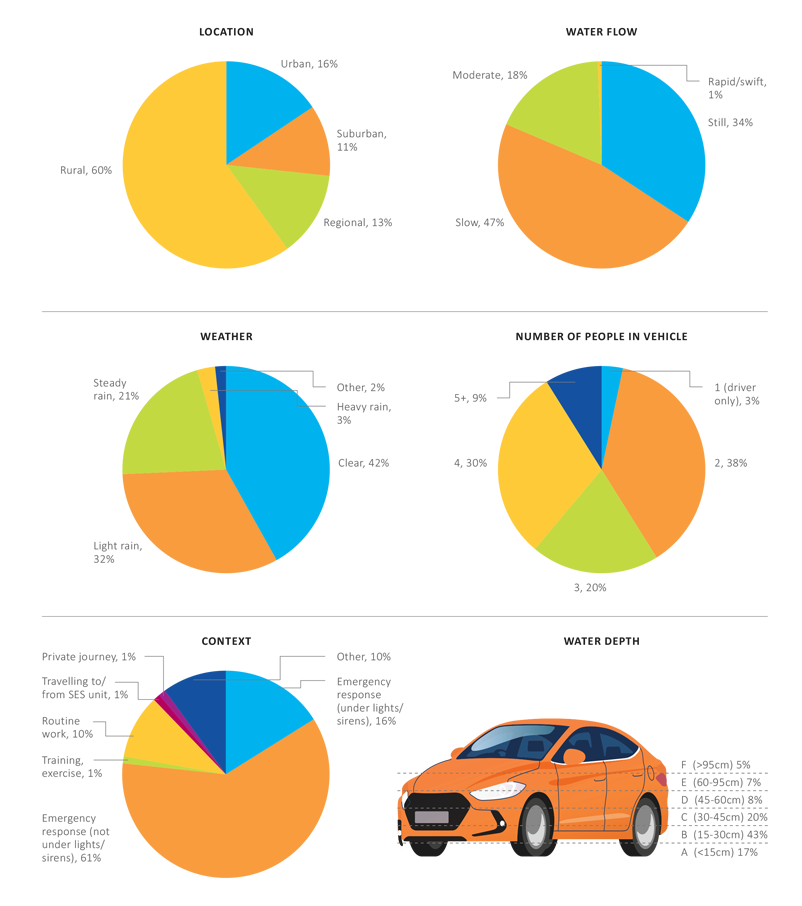
Figure 3: Snapshot of situations of entering floodwater as drivers or passengers in SES vehicles (n=180).
Table 2 summary data indicated that higher-risk events were reported more frequently in rural and remote areas and by those aged 45–54. However, overall numbers were small, or absent, in some categories and the statistical test was unreliable. All demographic variables were tested in this analysis but none had a relationship with higher-risk events.
In the survey, participants were asked the extent to which a number of aspects influenced their decision to drive through floodwater. They were presented with a list of 18 items. These related to the journey (e.g. urgency, lack of alternative route), their ability and experience (e.g. SES training, confidence), the influence of others (e.g. other road users, vehicle occupants) and work-related pressures (e.g. desire to complete duty). Respondents indicated the extent to which each item influenced their decision using a rating scale from 1 ('not at all') to 7 ('a great deal'). Independent samples t-tests were used to compare the mean ratings for the higher-risk and lower-risk events to explore aspects that had greater influence on risk taking. Figure 4 summarises data for the four items where there were statistically significant differences between mean ratings. Differences in mean ratings for all other items were not significant.
Figure 4 shows that the influence of other people in the vehicle plays a greater role in higher-risk events. This concurs with earlier findings. The variable, ‘Knowing the road well’, had less influence in higher-risk events. Although having a generally lower level of influence, ‘Organisational pressure to complete my duty’ had a stronger influence in higher-risk events. On a positive note, ‘Excitement’ of driving through floodwater had very little influence overall but did have a statistically significant difference between lower and higher-risk events.
Table 2: Selected χ2 analysis of higher-risk and lower-risk events with demographic variables.
| Classified risk level of reported event | ||||||
| Higher risk | Lower risk | |||||
| Independent variables | n | % | n | % | total | χ2 (P value) |
| Gender | ||||||
| Male | 23 | 15.9 | 122 | 84.1 | 145 | 7.737 (P<0.01) |
| Female | 12 | 37.5 | 20 | 62.6 | 32 | |
| Age | ||||||
| <35 | 7 | 21.2 | 26 | 78.8 | 33 | 8.440 (P=0.08) |
| 35-44 | 7 | 25.0 | 21 | 75.0 | 28 | |
| 45-54 | 12 | 25.0 | 36 | 75.0 | 48 | |
| 55-64 | 9 | 22.5 | 31 | 77.5 | 40 | |
| 65+ | 0 | 0 | 28 | 100.0 | 28 | |
| Location | ||||||
| Urban | 0 | 0 | 28 | 100.0 | 28 | 9.405 (P<0.05) |
| Suburban | 3 | 15.0 | 17 | 85.0 | 20 | |
| Regional | 7 | 29.2 | 17 | 70.8 | 24 | |
| Rural/Remote | 25 | 23.1 | 83 | 76.9 | 108 | |
| Did passengers in the vehicle influence the decision to drive into the floodwater? | ||||||
| Yes | 16 | 29.6 | 38 | 70.4 | 54 | 4.948 (P<0.005) |
| No | 18 | 15.1 | 101 | 84.9 | 1119 | |
Discussion
The survey data indicated a number of interesting and useful findings. Generally, the act of entering floodwater in SES vehicles could be regarded as commonplace, with just under half the survey sample driving, or being driven, through floodwater in the last two years. The profiling analysis identified some groups that are more likely to drive through floodwater and who could benefit from further training or safety awareness about alternative actions to entering floodwater. Interestingly, those who had driven through floodwater in an SES vehicle are likely to drive through floodwater in their own vehicle, which suggests a pattern and acceptance of behaviour. This finding points to mitigating actions to disrupt habitual driving behaviour and encourage other considered actions.
The conditions and contexts data provide an aggregated view of driving through floodwater and help identify the circumstances in which it is more likely to occur. The influence of passengers emerged as a recurring feature in the data. Most events involved the presence of passengers in the vehicle and passengers were found to influence decisions to drive through floodwater, including in higher-risk events. Open text responses were not provided by all respondents. Of those who commented, they generally highlighted passengers as a 'resource'; that they allowed discussion and assessment of the risks and provided knowledge and experience, rather than being a source of coercion or encouragement to take risks. However, it seems possible that social factors, inside and outside the vehicle, influence decisions in both positive and negative ways.
Similarly, perceived organisational pressure was mentioned in open comments of the survey. This related to the nature of activities taking place when driving through floodwater and was an influencing factor on the decision to drive through floodwater in higher-risk situations. While relevant, it may serve as post hoc justification for actions taken. A sense of urgency and purpose will always be part of SES duty. This is a possible area of investigation in relation to how it is used to rationalise or promote risky decision-making.
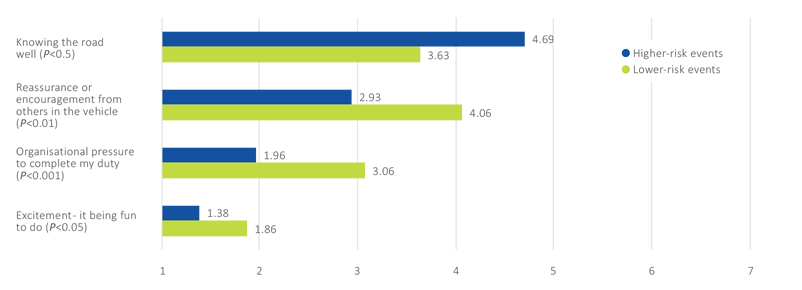
Figure 4: Aspects that influenced a decision to drive through floodwaters (n=174).
Study strengths and limitations
This study was supported by VICSES, including its senior management. Survey development had expert input to make it relevant to VICSES personnel. The survey data are detailed and the information gives it great utility. The use of a co-developed floodwater definition and a reference image for estimating water depth were important additions that improved data quality. However, although the sample size was good, the response rate was suboptimal and there is potential for both selection bias and recall bias. Recollection of events of driving through floodwater may be skewed to salient, and possibly extreme, events rather than 'typical' events. For these reasons, it is important to interpret the data as representative of the sample rather than of the VICSES population per se.
Focusing on higher-risk events was a constructive approach for utilisation of the study findings. However, a number of assumptions were made to categorise the riskiness of events that may not accurately reflect individual events in the data. In addition, sample size limitations mean that analysing higher-risk events needs to be interpreted with caution. Merging data from this study with data collected from other jurisdictions may overcome some of these limitations in future analysis.
VICSES utilisation of research
Encountering floodwater on roads is a common occurrence for VICSES personnel when responding to flood and storm situations. VICSES has developed operational doctrine to support members in assessing and managing the risk associated with floodwater (Victoria State Emergency Service 2018). In addition, VICSES launched a set of revised organisational values in 2018 and incorporated 'Safety Drives Our Decisions' to reflect the importance of safety to the organisation. This was rated by personnel as one of the highest of the five VICSES values.
Responses from personnel to encountering floodwater in this study provided a mix of cases that are consistent with the principles articulated in VICSES doctrine and cases that are inconsistent with these principles. This suggests a need to remind SES personnel that they are vulnerable to the potential risks posed by entering floodwater in their work and in private vehicles. This message is conveyed in the Victoria Government and VICSES awareness campaign, '15 to FLOAT'.2 A positive indication is that many respondents commented on explicit risk assessment and management measures they and their crews took during the recalled events described in the survey. However, as VICSES doctrine was only available for the previous year, it is probable that the recalled instances in this study took place prior to the VICSES doctrine being available. This is reinforced by there being only a relatively small number of flash-flood events and major broad-scale overland and riverine flooding last occurred in 2010–2012.
The findings from this research indicate that work to revise and enhance operational doctrine would provide advice on alternatives for entering floodwater. This advice could be alternate route planning by incident management teams and the greater use of rescue boats and helicopters.
The findings indicate that an approach focused on education of personnel with long service with VICSES or who frequently enter floodwater in their private vehicles would be beneficial. Also, the role of passengers in influencing the decision of a driver warrants further investigation. It is important that VICSES personnel understand that their actions can lead to influencing community members who may take similar actions.
Data from a 2020 national public survey on entering floodwater included additional insights into driver-passenger dynamics that could inform VICSES training and public communication (Taylor et al. 2020).
Approaches VICSES may take include developing training using virtual and augmented-reality systems that can replicate life-like hazard environments. This blended learning, combining electronic methods to represent flood and storm hazards, could incorporate learnings from this research. In addition, implementing broader workplace health and safety and risk assessment training would stimulate team discussion and build agreement. The findings of this research are being provided to VICSES personnel through regional forums to raise awareness of the danger of entering floodwater. These forums are an opportunity for discussion and learning about the principles of VICSES doctrine and their safe application.
Future research
This study is one of four being conducted by other SES in New South Wales, the Australian Capital Territory and South Australia. When jurisdictions complete reporting, the data will be merged (n=1200, approximately) and re-analysed. This will allow advanced statistical analysis to be undertaken. Work will continue with end users to identify additional uses of the data; for example, developing scenario vignettes for training based on actual events. In addition, as VICSES improves its workplace safety, these data may be a useful baseline from which to measure future change. The data reported in this paper relates to one part of three main sections of the survey. Other sections include a measure of workplace safety culture and the anticipated willingness to drive through water on the road in different scenarios. Both will be of value to end users.
Research is underway to test and validate a computer-based assessment of how SES members use cues in the environment to assess floodwater hazards on roads. This has potential for use in training and assessment of SES personnel. The focus of the last phase of the project is on utilising the evidence-based data from a number of studies and working with research end users to co-develop national flood risk communication guidelines.