In our technologically driven world, data is everywhere. And smart use of data will help emergency services keep pace with understanding complexities and informing complex decision-making.
In the world of emergency services, data can tend to be overwhelming. Understanding the usage—or lack of—a fire truck, a brigade or fire station is an essential part of providing support and services to the public when needed.
How can emergency services make the best sense of the general capability of their units? More importantly, what does this data mean as demographics change, populations grow and risks change, creating new vulnerabilities?
The South Australian Fire and Emergency Services Commission (SAFECOM) is well aware of the power of the data at its disposal. Thanks to research by the Bushfire and Natural Hazards CRC, SAFECOM has the ability to consider how the future might impact on their fleet and the services that the Metropolitan Fire Service (MFS), Country Fire Service (CFS) and State Emergency Service (SES) provide.
Dr Andre Costa at the University of Adelaide leads this research project undertaken specifically for SAFECOM. It has resulted in a data analysis tool used to visually assess the use of resources. The tool was born out of a discussion that recently retired SAFECOM CEO, Malcolm Jackman, had with Bushfire and Natural Hazards CRC CEO, Dr Richard Thornton, around the principle that better understanding of data supports better decision-making about capability.
Mr Jackman said, ‘We had this conversation about: can you take all the data, pull it together, analyse it and can you tell us what it’s saying in terms of response times; in terms of call-outs utilisation?
‘We are continually looking at what our footprint looks like. Changing demographics and risk profiles means that our existing footprint may not be the contemporary footprint of the future,’ said Mr Jackman.
The emergency services use the tool to analyse information from the past seven years to measure response times, allocation of resources and dispatch systems of the network of fire and emergency appliances, as well as personnel.
‘We take about 45,000 calls a year, responding to any emergency that people call in and we looked at the data from around 300,000 individual incidents,’ explained Mr Jackman.
The potential of this real-world data is what most excited Dr Costa.
‘People are becoming a lot more open to the idea that there is some value to be extracted from the data they already have.
‘The great thing about data analytics is that people give you their real-world data sets, actual things they care about and they want to extract information from.
‘We spent a bit of time with the people responsible for data in the MFS, CFS and the SES and asked them to check if we were interpreting the data correctly,’ Dr Costa explained.
The software tool encompasses the statistics and visualisation of events and utilisation of appliances and fire stations spanning from 2012 to 2018 across South Australia’s three emergency services – the MFS, CFS and SES (see Figure 1).
‘What the software tells us is what would happen if we pulled this asset (out of service) or if we pulled this location (out of service), what would the response look like then?’ Mr Jackman explained.
The functionality gives senior management at the MFS, CFS and SES the ability to visualise years of data onto a basic level and to highlight the areas where capability and capacity gaps have occurred or are likely to occur. This can help make decisions easier and provide an insight in how to better plan and prepare for the future. The software provides the keys to access this window into the future.
‘Once they (emergency services) make the decision and change how they do things, they are going to be able to see those changes and track that within the tool,’ said Dr Costa.
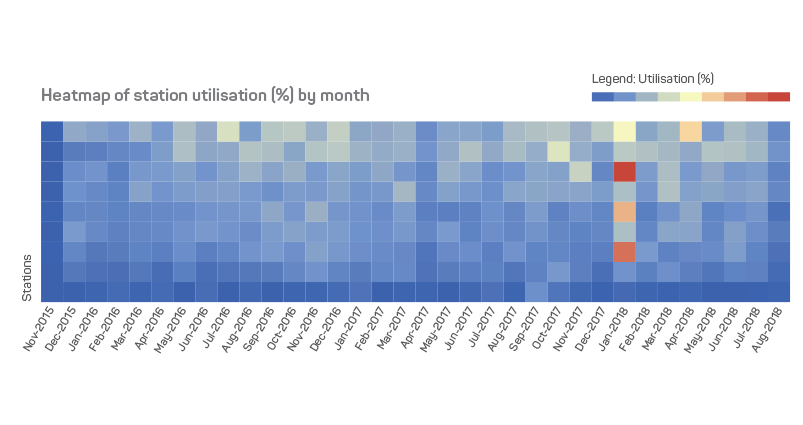
Figure 1: The data analysis tool allows mapping of resources use over the seven-year period used in the research (note: three years shown).
It is this planning that is at the core of ensuring South Australia’s emergency services are ready for the coming decades.
‘What we’ve been able to do with this tool is not just look at individual units but look at groups of units,’ Mr Jackman said.
‘We’ve been able to look at the three services combined or an individual service by itself. We can slice and dice it in many ways.
‘In places where we know population growth is going to happen, we can say ‘well look, the usage (of an individual truck, brigade or unit) five years ago was this, it now looks like this, if you run it out another five years, what’s that going to tell you?
‘The next step is if you see an increase in usage, is it because of increasing population, industry... what’s driving that, is it a sustained trend, and if it is a sustained trend what do we think it’s going to look like in the future?’ Mr Jackman said.
Time series of activity levels and rolling response time statistics, a calendar activity view that drills down to show detailed event timelines and appliance history, heatmaps and distribution charts of station, unit and appliance use are all part of the tool’s interactivity and a way of displaying data in a user-friendly format.
The tool provides a better understanding of how the resources that make up South Australia’s emergency services are used at various times, for various events. In doing so, cost management, resource allocation and future emergencies can be managed more efficiently and directly.
The scope of the data analysis and its potential to be applied to a wide variety of other organisations within the emergency sector is an essential element for the management of natural hazards both now and in the future.
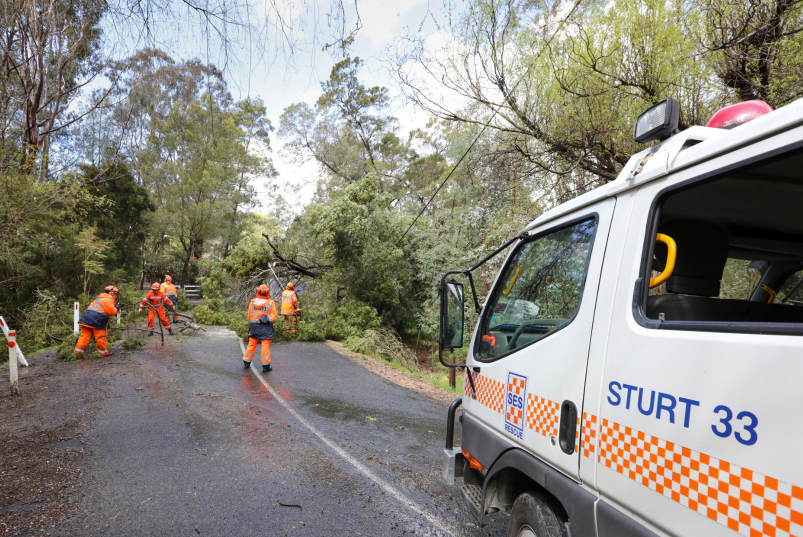
South Australian SES crew manage a fallen tree during floods in Adelaide. Image: South Australia SES
‘There are a number of avenues that applied research could go down. We want to predict what might happen or do “what if” experimentation and the next step is to try and build a model of the system to forecast what would happen if we added resources here; how would that affect response times,’ explained Dr Costa.
Armed with the tool to make sense of the data at their disposal, South Australia’s emergency services will be able to tackle the future head on. In a world where technology rules and budgets are struggling to keep up with the costs of delivering services, working out how to get the best bang for the buck is essential.
‘At the end of the day, there’s only a finite amount of money left to spend. Where do we spend it? Why do we spend it, and what are the consequences of this expenditure? This is what the tool allows us to achieve,’ said Mr Jackman.