Abstract
Annual reports of 11 volunteer-based emergency services organisations were analysed to determine how volunteers are valued in terms of human capital. A simple method was designed to enable comparison between agencies on nine categories of human capital being volunteer numbers, gender, age, length of service, diversity (three types), training and awards. The results were compared to the disclosure of the same categories pertaining to paid staff. Results showed that narratives of annual reports gave recognition and praise to volunteers but human resources sections reported primarily on paid staff. Data on volunteer numbers and diversity are poorly reported in many annual reports. It was found that human capital, if applied to both paid staff and volunteers, could be a suitable tool to validate volunteers in an annual report.
Introduction
Emergency services organisations (ESOs) assign highly trained responders to respond to events such as bushfires, floods, storms and road accidents. The workforce of the majority of these organisations is volunteer-based such as the various state emergency services and country and rural fire brigades and services.
In Australia, ESOs are predominately funded by government via levies that property owners pay through home insurance or council rates (depending on the state or territory). If volunteers were replaced by paid staff, the cost to the community would be significant (Ganewatta & Handmer 2009, McLennan 2008). Communities, businesses and governments therefore have a vested interest in the good management of ESOs particularly in respect to statutory obligations, accountability and sustainability.
The National Emergency Management Volunteer Action Plan, 2012 (Attorney- General’s Department 2012) includes recruitment and retention of emergency services volunteers as issues of national importance. The plan includes nine focus areas with specific actions that include training and volunteer support. The plan also highlighted a lack of community awareness about the roles and value of volunteers and recommends this to be a priority action for government and communities.
This research looked at how ESOs articulate volunteer value and reasoned that annual reports, as corporate performance reporting publications, provide disclosure of the number of volunteers in the service, the fluctuations by year and the composition of this workforce with respect to gender, diversity, training, education, length of service and age groups.
Different jurisdictions have different classifications of the term ‘ESO’. This paper defines ESOs as fire services and state emergency services as described in Volume D of the Report on Government Services 2016 (Productivity Commission 2016). This definition excludes police and ambulance services.
In Australia, ESOs are required by law to declare an annual financial statement that includes an audit report according to standards set by the Australian Standards Board (Kilcullen, Hancock & Izan 2007). An annual report commonly includes a vision statement, a CEO or Commissioner message, an overview of the reporting year activities and performance achievements and forecasts. Increasingly annual reports incorporate human resources details such as the number of personnel, age profiles, gender, diversity, skills and other benchmarks. These voluntary disclosures are also increasingly included in government-level reporting. In general, ESOs follow state and territory government guidelines for the compiling of annual reports, most of which are tabled with respected state parliaments and territory legislative assemblies.
Corporate social responsibility
Voluntary disclosures in annual reports follow a trend by business and not-for-profit organisations to meet the demands of varied stakeholders who increasingly want to see more transparency in the organisation’s performance, compliance with government regulations and reflections of societal expectations. This practice acknowledges the social and environmental impacts organisations have on communities and is closely tied to what is termed corporate social responsibility (CSR). It includes philanthropic outreach such as corporate volunteerism, returning a percentage of profits to communities, environmental-positive policies (for example, see Metropolitan Fire Brigade 2017) or supporting campaigns that address the concerns of a community (for example, see Northern Territory Police, Fire and Emergency Services 2016 White Ribbon Australia accreditation).
Carroll (2010) defined CSR as comprising ‘the economic, legal, ethical and discretionary or philanthropic expectations that society has of organisations at a given point in time’. While not enforced, the principle is now well developed in many businesses and has been incorporated into standards that provide guidance to organisations and government departments on how to implement CSR initiatives (International Organisation for Standardization 2017).
Intellectual capital
The advances made in technology and science in the last 50 years have led to ‘knowledge-based’ societies and economies (Boedke, Guthrie & Cuganesan 2005). In an attempt to validate ‘knowledge’, the term ‘intellectual capital’ was coined in 1990 (Sullivan 2000) as the intangible or non-physical assets that may give an organisation an advantage over others (Guthrie & Petty 2000, Sullivan 2000). More specifically, Boedker and colleagues (2005) and Nerantsidis and co-authors (2013) define it as the ‘sum of human, internal and external capital that positively influences an organisation’. Figure 1 provides a model of intellectual capital showing the internal, human and external factors.
Although reporting of intangibles such as intellectual capital have been slow to develop in routine accounting procedures, several models have been proposed and discussed by Petty and Guthrie (2000) and Starovic and Marr (2003). Once implemented, organisations benefit by streamlining managerial processes, in particular human resources, and find it to be an instrument for effective strategic decision-making (Veltri & Bronzetti 2014a). It is also suitable for not-for-profit organisations to build and develop robust public images (Veltri & Bronzetti 2014b).
Fletcher and colleagues (2003) studied stakeholder perceptions for intellectual capital in the Australian Red Cross Blood Service. Dumay and Rooney (2011) investigated if intellectual capital measurement in the former NSW Department of Lands was necessary for effective management. Veltri and Bronzetti (2014b) studied a not-for-profit organisation with over 9000 volunteers that used intellectual capital for image building. Marr and colleagues (2003) caution that more research is needed into the positive and negative effects of disclosing intellectual capital information.
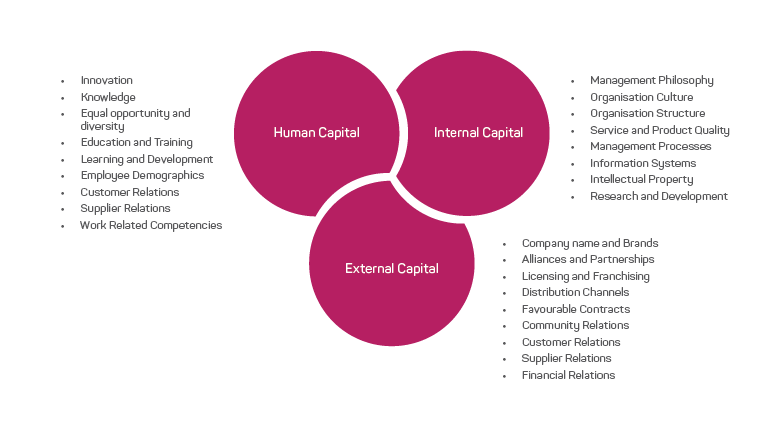
Figure 1: The tripartite model of intellectual capital. Source: Reproduced from Boedker, Guthrie & Cuganesan 2005
Human capital disclosure in volunteer-based ESOs
Human capital is inherently based on the education, training and the uniqueness of an individual’s capabilities to deliver tasks for which he or she is employed, regardless of function. Birch (2011), in research of volunteer fire brigades, introduced Putnam’s concept (2000) of volunteering as social capital. In accounting terms, individual capability, or social capital, could be termed as goodwill (Adler & Kwon 2002) to the organisation. Organisations benefit from a person’s talent and personality (individual capability) and from a person’s social networks, trust and social skills that facilitates interactions with others (Degli Antoni & Portale 2011, also see Payne et al. 2011 for a comprehensive overview).
Several literature reports (Cordery & Narraway 2010, Cordery, Proctor-Thomson & Smith 2011, Cordery et al. 2013, Hyndman & Jones 2011, Mook et al. 2005, Mook, Handy & Quarter 2007, Narraway & Cordery 2008, Sinclair & Bolt 2013) developed methods for validating volunteers. Surprisingly, intellectual capital was not identified as an accounting tool for valuing volunteers in annual reports. There have been suggestions that volunteer hours should be reported in financial reports as revenue using the same rigour where staff salaries are reported as a cost (Cordery & Narraway 2010, Mook et al. 2005, Narraway & Cordery 2008, O’Brien & Stuart 2013). Australian accounting practices class the financial value of contributions by volunteers as ‘non-reciprocal transfers’ that can only be expressed as a revenue ‘when they create assets, require specialist skills and would have been purchased if not provided by donation’ (Kilcullen, Hancock & Izan 2007). Ryan and colleagues (2010) argue for alternative financial reporting for notfor- profit organisations to reflect the needs of their particular stakeholders.
Handmer and Ganewatta (2007) used two models to estimate value of volunteers being the ‘global substitution method’ (based on an average wages) and the ‘task specific substitution’ method (based on the market wage for each task). The authors reflected on the nature of emergency services volunteering where considerable time is given to training, administration and being on stand-by compared to operational activities. This requires detailed record keeping by the organisation that may not be feasible for smaller organisations. These were found to be barriers for disclosing volunteer value in a study by Cordery and colleagues (2013).
Volunteer numbers
Previous research on volunteer retention in ESOs (Baxter-Tomkins 2011, Birch 2011) noted the difficulty in obtaining reliable data on volunteer numbers. The Federal Report on Government Services 2016 (Productivity Commission 2016) lists the number of volunteers in ESOs; however, data from four states were not included. The Australian Bureau of Statistics publishes regular statistics on emergency services volunteers ‘involved in search, rescue and disaster relief’ from data collected through the General Social Survey. These numbers include relief volunteers in the Red Cross Disaster Recovery Service, the Salvation Army Disaster Services and possibly others (Australian Bureau of Statistics 2016). Thus, statistics from this source provided minimal utility for this research.
Research analysis
O’Brien and Stuart (2013) analysed over 400 Australian not-for-profit organisations for volunteer disclosure in the narrative of their annual reports. They counted the frequency of acknowledgment of volunteer contribution, human resource measures and hours contributed. This study advanced this work by looking specifically at the annual reports of the volunteer-based ESOs. The research questions were:
- To what extent is human capital disclosed in the annual reports of volunteer-based ESOs?
- Is human capital disclosure similar for paid staff and volunteers?
- Could the expression of human capital in annual reports be a suitable process to validate volunteer contribution in ESOs?
- How many volunteers serve in the ESOs?
Method
The annual reports of 2015 and 2016 from 11 Australian volunteer-based ESOs were accessed via each organisation’s website. Table 1 provides a summary of ESOs included in this study. The agencies were allocated a random number to avoid identification as the aim was to analyse the sector as a whole. Umbrella organisations are indicated with an asterisk.
A template was designed to record the number of staff and volunteers, their age range and classification of role in the organisation, diversity (gender, disability, cultural and linguistic diversity and number of Aboriginal and Torres Strait Islander employees) in each ESO. These categories were considered the most important for stakeholders interested in the operational capacity of an organisation.
The reporting of the organisation’s vision, volunteer hours committed, length of service, medal and award presentations, qualifications and training of staff and volunteers were noted. In some reports, staff and volunteers are quoted as ‘members’. The study distinguished between paid staff and volunteers. ESOs in New South Wales, South Australia and Victoria submit an independent annual report. Volunteer-based ESOs in the other states and territories are administered by government departments or directorates that encompass several agencies (umbrella organisations). In addition, over 6000 volunteers were involved in community fire units that are administered by Fire and Rescue NSW. They were not included in the annual report analysis but were included in the number of ESO volunteers.
|
State |
Volunteer-based ESO |
|
Australian Capital Territory |
*ACT Justice and Community Safety Directorate
|
|
New South Wales |
NSW Rural Fire Service NSW State Emergency Service |
|
Northern Territory |
*Northern Territory Police Fire and Emergency Services:
|
|
Queensland |
*Queensland Fire and Emergency Services:
|
|
South Australia |
*South Australian Fire and Emergency Services Commission (SAFECOM)2 South Australia Country Fire Service South Australia State Emergency Service |
|
Tasmania |
**State Fire Commission Tasmania Fire Service (also employs career firefighters) Tasmania State Emergency Service3 |
|
Victoria |
Country Fire Authority (also employs career firefighters) Victoria State Emergency Service |
|
Western Australia |
*Department of Fire and Emergency Services
|
* The ‘umbrella’ administrative body for the ESO.
Table notes
- Bushfires NT was not compared in this study. Their 22 units (~500 volunteers) were individually incorporated; annual reports are not available online.
- As the 2015-16 reports for the South Australia volunteer-based ESOs were not available at the time of writing, data from SAFECOM was used for both years.
- Data for the Tasmania State Emergency Service were taken from the annual reports of the Department of Police and Emergency Management for 2015 and the State Fire Commission for 2016.
Nine human capital categories were recorded for each annual report where the sum of these categories could total the maximum value of 100 (Table 2). The scores were allocated by increments of five.
For the staff and volunteer numbers category, a score of 20 was given only when the position classification (for volunteers the breakdown of ‘operational’ or ‘support’ was considered a full classification) was disclosed. Absence of such resulted in a score of 10. Annual reports that mentioned the numbers in the narrative without any further details scored 5. Annual reports that gave an approximate number scored 5 (this is the category ‘Numbers, approximate’ in Figures 2 and 3).
For the gender analysis category, a full score of 10 was given to data that provided a breakdown of staff and volunteers by gender but was reduced to 5 for data that showed gender as a percentage of the total workforce rather than providing numerical data.
The other categories (age profile, length of service, diversity and Aboriginal and Torres Strait Islander peoples) were either fully reported in the annual reports (score of 10) or not at all (score of 0). For example, Table 3 shows the score for Agency 7.
Results and discussion
The annual reports were analysed of selected volunteerbased ESOs for 2014-15 and 2015-16. Some were found to be highly individual, engaging and richly illustrated with images, figures, data and events and praise for volunteers.
Stakeholders
Many of the annual reports mentioned external stakeholders or relevant stakeholders as being important to be considered at all levels of operation. However, only four ESOs defined who their stakeholders were, of which three were umbrella government departments. Two agencies included volunteers as their stakeholders and one mentioned the community.
Human capital disclosure in annual reports
Figures 2 and 3 show the number of ESOs that reported on the human capital categories listed in Table 2. The data compares paid staff to volunteers for the two reporting periods. The numbers are represented in three separate data series to express the difference in disclosure (numbers and the staff and volunteer position, numbers only and approximate numbers, or numbers given in the narrative). Five ESOs reported the number of staff according to this study in Table 1 (both years). Four reported volunteer numbers and positions. It was similar for both years. Two ESOs reported approximate volunteer numbers and staff in the annual report of 2015 and three did so in the 2016 report.
Volunteer numbers are subject to fluctuation and record keeping at a brigade or unit level can be a challenge. However, it reflects poorly on ESOs when approximate volunteer numbers, rounded to the nearest 100, are reported.
Table 2: Score for human capital disclosure in annual reports of volunteer-based ESOs.
| Human capital category | Score |
| Staff and volunteer numbers | 20 |
| Gender analysis | 10 |
| Age profile | 10 |
| Length of service | 10 |
| Diversity: Aboriginal and Torres Strait Island peoples | 10 |
| Diversity: Disability | 10 |
| Diversity: Cultural and linguistic diversity | 10 |
| Training | 10 |
| Awards | 10 |
| Total score | 100 |
Gender and diversity
A breakdown of staff and volunteer numbers by gender was reported by seven ESOs in 2015. One organisation did not publish this data the year after. By contrast, data on the gender of volunteers is largely missing with only three agencies reporting this in 2015. Only two agencies disclosed the breakdown in 2016 annual reports.
The Workplace Gender Equality Act 2012 (Australian Government 2013) requires private sector organisations in Australia with more than 100 employees to report annually against gender equality indicators including employment status, pay analysis and policies that support families. The disclosure of such data in annual reports, irrespective of the number of employees or the type of business or service, could be considered a social responsibility as stakeholders can verify if organisations comply with gender equality expectations.
Age and length of service
The age of staff was reported by five ESOs (both years). However, the breakdown of age for volunteers was included in only two reports in 2015 and one in 2016. There was very little disclosure in the annual reports on the length of service of the workforce (one report) and its diversity. However, scarce as this data is, volunteers were considered in one report in 2016.
Table 3: Human capital score for ESO 7 based on its annual report of 2015-16.
| Human capital category | Score | Volunteers |
| Staff and volunteer numbers | 20 | 20 |
| Gender analysis | 10 | 0 |
| Age profile | 10 | 0 |
| Length of service | 0 | 0 |
| Diversity: Aboriginal and Torres Strait Islander peoples | 10 | 0 |
| Diversity: Disability | 10 | 0 |
| Diversity: Cultural and linguistic diversity | 10 | 0 |
| Training | 0 | 5 |
| Awards | 0 | 5 |
| Total score | 70 | 30 |
Training and recognition
Training was better reported for volunteers than for staff while recognition in terms of awards or medals was overall poorly reported. Some agencies wrote about outstanding training programs that were developed or brought to Australia from another country. These programs add enormous value to the organisation and can be considered as ‘internal capital’.
Overall, Figures 3 and 4 show that ESOs provided more detail on staff human capital compared to volunteers. Data on workforce diversity and length of service were especially lacking. Training was one aspect where agencies were keen to report and more so for the volunteer workforce than for staff.
Figures 4 and 5 express the total human capital score (Table 2) per organisation. Scores under 20 correspond to the numbers of staff and volunteers only.
Some variation exists between the two reporting periods. Organisations disclosed more one year than the following year or vice versa. For example, Agency 2 reduced the score of human capital from 65 to 55 for staff and 40 to 30 for volunteers in 2014-15 and 2015-16, respectively. The difference of ten is due to the gender breakdown not being provided in 2015-16. Similarly, Agency 11 scored higher in 2015-16 due to clearer reporting of medals and awards for both staff and volunteers. Agency 4 reported on gender for staff and volunteers in 2014-15 but omitted this in 2015-16. The higher score of volunteers compared to staff for this organisation is due to the reporting of training, medals and awards for volunteers only. Agency 10 gained a score of 20 in 2015-16 compared to the year before due to the breakdown of gender and age for staff in that year. These categories were missing for volunteers in the same annual reports.
ESOs 6 and 7 scored 70 for staff in both years. This corresponds to staff numbers and position, gender, age and diversity. One of those agencies also reported on the length of service of staff. In contrast, these agencies had a much lower score for volunteers. ESOs 1, 5 and 8 and all umbrella government departments reported minimal human capital disclosure. The reduced score of ESO 8 in 2015-15 could be due to the restructuring of departments.
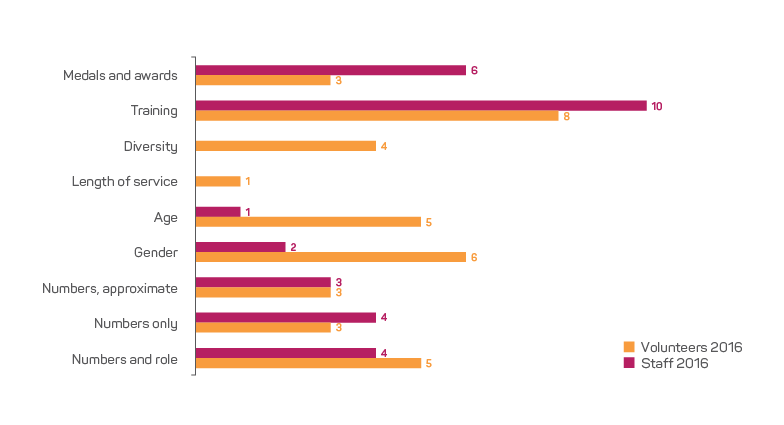
Figure 2: Numbers of volunteer-based ESOs that reported the human capital categories in 2014-15 according to the categories in Table 2.
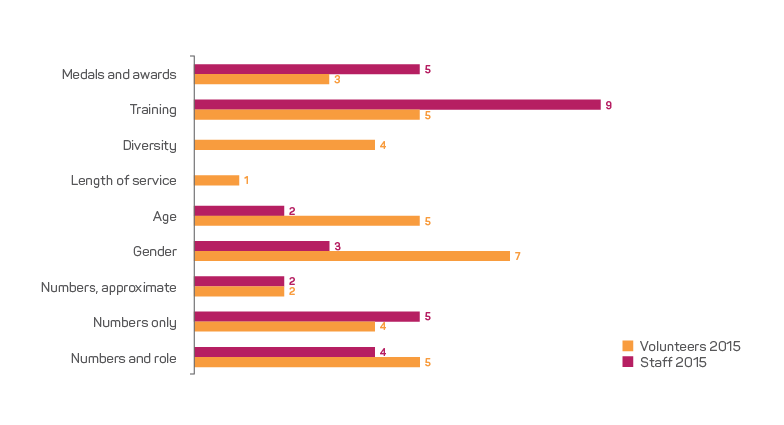
Figure 3: Numbers of volunteer-based ESOs that reported the human capital categories in 2015-16 according to the categories in Table 2.
Volunteer numbers
The number of volunteers in volunteer-based ESOs for two consecutive years is given in Figure 6 and is based on the disclosure in annual reports. One organisation did not provide volunteer numbers in 2015 and another did not do so in 2016; in this case the numbers from the next or previous year were used. Some agencies used volunteer estimates by providing a rounded number.
The data show a reduction of 2555 volunteers during the 2016 reporting period. This is largely due to a loss of volunteers in NSW (~1500) and Western Australia (~2100). In Queensland the number of ESO volunteers increased by ~1300. Volunteer hours were not reported consistently. Only six agencies disclosed the hours in 2015 and eight did so in 2016. Due to incomplete data on gender or volunteer roles, no further analysis could be made.
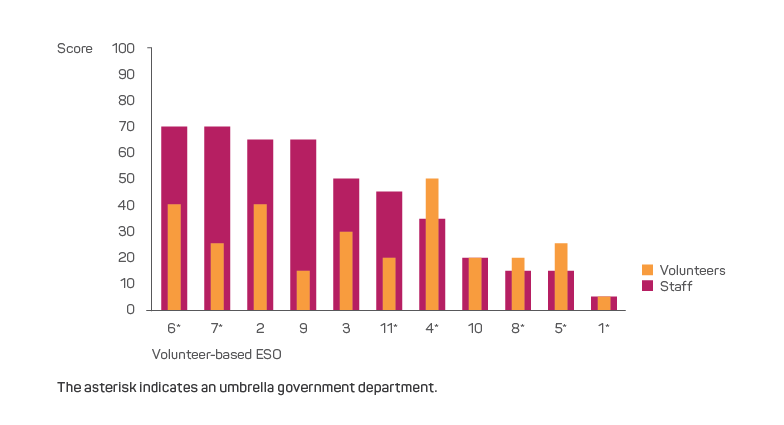
Figure 4: Disclosure of human capital in annual reports for 2014-15 of volunteer-based ESOs.
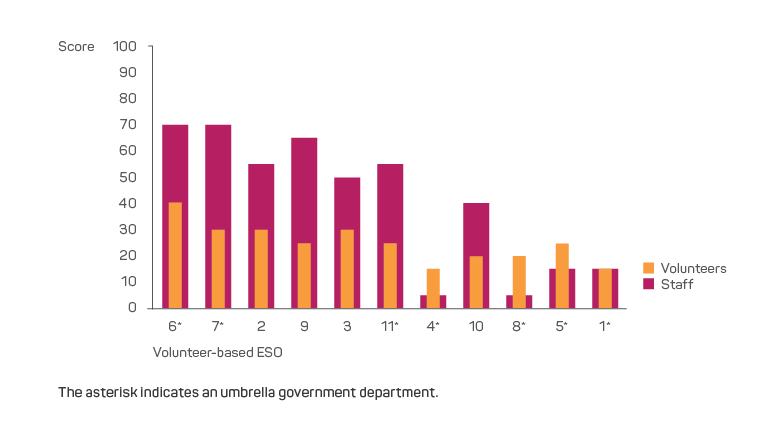
Figure 5: Disclosure of human capital in annual reports for 2015-16 of volunteer-based ESOs.
Conclusion
Volunteers are the raison d’etre of the majority of Australian ESOs. Paid staff cannot fulfil the operational requirements of the organisation and volunteers fulfil support and strategic roles. The narrative of annual reports gives recognition and praise to volunteers, yet human resources sections disclose more human capital details for staff than they do for volunteers. This is of concern in a climate where volunteer retention is paramount to the survival of volunteer-based organisations.
The scoring system used for nine categories of human capital provided a numerical tool to analyse and compare 11 volunteer-based ESOs. This system contributes to existing information and provides a tool to compare human capital categories between similar organisations. Results indicate that large variations exist in the disclosure of human capital in ESOs and that reporting of staff and volunteers is asymmetrical.
There are possible factors that can explain the variety in disclosure. Organisations may need to adhere to certain guidelines that stipulate what can be disclosed outside the annual report. Stakeholders may have influenced additional guidelines and the organisation has not yet embraced a suitable accounting and validation method for their volunteer administration. Differences in reporting between states and territories could also be a factor.
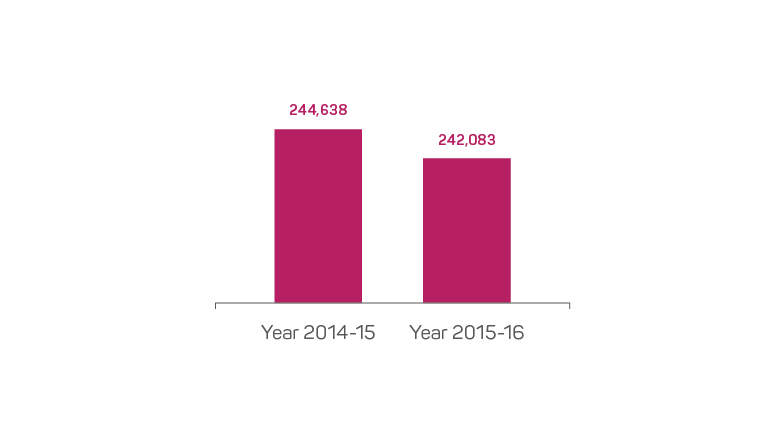
Figure 6: The number of volunteers in ESOs. The data includes volunteers in Fire and Rescue NSW that operate community fire units (6812 in 2015 and 6318 in 2016).
Taking into account that 55 per cent of agencies already disclose some human capital information in their annual reports, further development in accounting procedures that includes substantial volunteer data would be a suitable method to validate volunteer contribution in ESOs. Several ESO annual reports contain a concise overview of numbers of volunteers, numbers of incidents and operational hours.
The omission of gender and diversity disclosure (for both staff and volunteers) was unexpected as the Australasian Fire and Emergency Service Authorities Council (AFAC) acknowledges that ‘changes (are) required to increase attraction, recruitment and inclusion across gender, racial and cultural diversity’ (AFAC 2016).
This research confirms a previous study on annual reports of Australian Government departments that found that mandatory reporting on human resources is below average (Herawaty & Hoque 2007). In the light of the finding that three out of the seven umbrella organisations disclosed little human capital information compared to independent agencies, the question arises whether an amalgamated annual report (one that includes several ESOs) serves the interest of the organisations. For example, the ACT State Emergency Service published a snapshot report of the organisation online that includes a wide variety of volunteer statistics including gender, age group, length of service and training competencies (Borrett & Slarke 2014-15). This information was not detailed in the annual report of the ACT Emergency Services Agency for that year.
While some agencies disclosed volunteer numbers and other relevant details, other agencies gave only an estimate of volunteer numbers (rounded to the nearest 100) and two agencies omitted volunteer numbers altogether in their report. The calculations and estimates used here show that volunteer numbers were 244,638 in 2015 and 242,083 in 2016. However, no further breakdown of numbers in roles, gender and diversity could be made.
This research is of a preliminary nature and future work to support intellectual capital disclosure in volunteerbased ESOs could build on previous case studies. The human capital reporting could be expanded from the nine categories used in this study to include other categories such as education background and level of training. Introducing intellectual capital into bookkeeping may involve initial costs and present a cultural challenge, however, Veltri and Bronzetti (2014a) suggest it can be gradually introduced and adapted to the specifics of an organisation.
ESOs build operational capacity with a predominantly volunteer workforce. Validating volunteers in annual reports to the same level as paid staff creates a visible shift towards recognising and valuing the work of the emergency services volunteer. A workforce, regardless of being paid employees or volunteers, would feel pride in an organisation that gives due recognition to the sum of its human endeavour.